Analysis
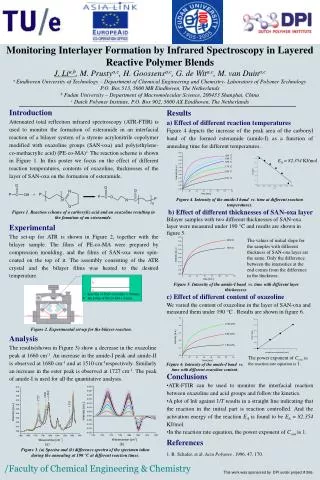
Figure 2. Experimental set-up for the bilayer reaction. a: thin film of SAN-oxazoline (~ 600nm) b: thick film of PE-co-MA (~1mm). b. a. 1680. 1660. 1727. 1510. (a). (b) .

Analysis
E N D
Presentation Transcript
Figure 2. Experimental set-up for the bilayer reaction. a: thin film of SAN-oxazoline (~ 600nm) b: thick film of PE-co-MA (~1mm) b a 1680 1660 1727 1510 (a) (b) Figure 3. (a)Spectra and (b)difference spectra of the specimen taken during the annealing at 190 °Cat different reaction times. Monitoring Interlayer Formation by Infrared Spectroscopy in Layered Reactive Polymer Blends J. Lia,b, M.Prustya,c, H. Goossensa,c, G. de Wita,c,M. van Duina,c a Eindhoven University of Technology – Department of Chemical Engineering and Chemistry- Laboratory of Polymer Technology P.O. Box 513, 5600 MBEindhoven, The Netherlands b Fudan University – Department of Macromolecular Science, 200433 Shanghai, China c Dutch Polymer Institute, P.O. Box 902, 5600 AX Eindhoven, The Netherlands Introduction Results Attenuated total reflection infrared spectroscopy (ATR-FTIR) is used to monitor the formation of esteramide in an interfacial reaction of a bilayer system of a styrene acrylonitrile copolymer modified with oxazoline groups (SAN-oxa) and poly(ethylene-co-methacrylic acid) (PE-co-MA)1. The reaction scheme is shown in Figure 1. In this poster we focus on the effect of different reaction temperatures, contents of oxazoline, thicknesses of the layer of SAN-oxa on the formation of esteramide. a) Effect of different reaction temperatures Figure 4 depicts the increase of the peak area of the carbonyl band of the formed esteramide (amide-I) as a function of annealing time for different temperatures. EA = 82.354 KJ/mol Figure 4. Intensity of the amide-I band vs. time at different reaction temperatures. b) Effect of different thicknesses of SAN-oxa layer Figure1. Reaction scheme of a carboxylic acid and an oxazoline resulting in the fomation of an esteramide. Bilayer samples with two different thicknesses of SAN-oxa layer were measured under 190 °Cand results are shown in figure 5. Experimental The set-up for ATR is shown in Figure 2, together with the bilayer sample. The films of PE-co-MA were prepared by compression moulding, and the films of SAN-oxa were spin-coated on the top of it. The assembly consisting of the ATR crystal and the bilayer films was heated to the desired temperature. The values of initial slope for the samples with different thickness of SAN-oxa layer are the same. Only the difference between the intensities at the end comes from the difference in the thickness. Figure 5. Intensity of the amide-I band vs. time with different layer thicknesses. c) Effect of different content of oxazoline We varied the content of oxazoline in the layer of SAN-oxa and measured them under 190 °C. Results are shown in figure 6. Analysis The results(shown in Figure 3) show a decrease in the oxazoline peak at 1660 cm-1, An increase in the amide-I peak and amide-II is observed at 1680 cm-1 and at 1510 cm-1respectively. Similarly an increase in the ester peak is observed at 1727 cm-1. The peak of amide-I is used for all the quantitative analysis. The power exponent of Coxain the reaction rate equation is 1. Figure 6. Intensity of the amide-I band vs. time with different oxazoline content. Conclusions • ATR-FTIR can be used to monitor the interfacial reaction between oxazoline and acid groups and follow the kinetics. • A plot of lnk against 1/T results in a straight line indicating that the reaction in the initial part is reaction controlled. And the activation energy of the reaction EA is found to be EA = 82.354 KJ/mol. • In the reaction rate equation, the power exponent of Coxais 1. References 1.R. Schafer, et al.Acta Polymer., 1996, 47, 170. This work was sponsored by DPI under project # 266.