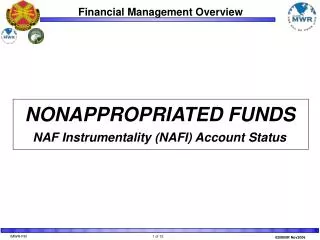
NONAPPROPRIATED FUNDS
NONAPPROPRIATED FUNDS. NAF Instrumentality (NAFI) Account Status. Total MWR NAFIs Worldwide Net Revenue* FY06 / 3rd Qtr FY06 Budget vs Actual 3rd Qtr FY 07 Budget vs Actual. $Millions. * Revenue adjusted for MWR UFM/USA Income. Total MWR NAFIs Non-Operating Revenue


NONAPPROPRIATED FUNDS
E N D
Presentation Transcript
NONAPPROPRIATED FUNDS NAF Instrumentality (NAFI) Account Status
Total MWR NAFIs Worldwide Net Revenue* FY06 / 3rd Qtr FY06 Budget vs Actual 3rd Qtr FY 07 Budget vs Actual $Millions * Revenue adjusted for MWR UFM/USA Income
Total MWR NAFIs Non-Operating Revenue FY06 Actual / FY07 Budget vs Actual $ Millions
Total MWR NAFIs Net Revenue* - by RegionFY06 Actual / 3rd Qtr FY07 Budget vs Actual $Millions FMWRC-AFRCs * Revenue adjusted for MWR UFM/USA Income
Total MWR NAFIs Worldwide NIBD/Net Income FY06 / 3rd Qtr FY06 Budget vs Actual 3rd Qtr FY 07 Budget vs Actual $Millions
Total MWR NAFIs NIBD by RegionFY06 Actual / 3rd Qtr FY07 Budget vs Actual $Millions FMWRC-AFRCs
NIBD %, By Region, Versus Army Standard * Percentage Based on MWR UFM/USA – Net Revenue ** Includes MACOM HQ and Single MWR Funds.
NIAD %, By Region * Percentage Based on MWR UFM/USA – Net Revenue
Total MWR NAFIs NIBD by Major Program (Chart 1) FY06 Actual / 3rd Qtr FY07 Budget vs Actual $Millions
Total MWR NAFIs NIBD by Major Program (Chart 2) FY06 Actual / 3rd Qtr FY07 Budget vs Actual $Millions
Total MWR NAFIs NIBD by Major Program (Chart 3) FY06 Actual / 3rd Qtr FY07 Budget vs Actual $Millions
Total MWR NAFIsNIBD for Clubs, Branded Restaurants and FBEFY06 Actual / 3rd Qtr FY07 Budget vs Actual $Millions Note: Clubs, Branded Restaurants and FBE reported separately.
CPO FMD SVCS MKTG ACCT Program Overhead MWR DIR/ DEPUTY/ FUND ADM REGION Staff Contracting/ IM/Other Overhead Costs FY06 Actual* / 3rd Qtr FY07 Budget vs Actual* $Millions *NLBD adjusted to remove external income and properly align expenses.
Net Income Before Depreciation 3rd Qtr FY 07 Garrison/Region MWR Operating Results Sources Uses AMWRF Div $3.3 Interest ALF Pymt $4.4 Recycle - $0.6 Food, Bev Opns - $3.1 $17.4 $9.2 - $8.0 - $13.9 Bowling $11.6 $6.6 -$3.7 Tot Outdoor Rec $34.6 ARM $9.3 -$3.3 Guesthouses $1.5 - $7.1 -$8.0 $23.5 FMWRC-AFRCs - $8.1 $6.1 - $8.0 $66.5 - $6.3 AAFES Contract/IM/Oth Golf Leisure Tvl $1.3 Auto$1.1 FY 06 $226.5M - 89.3M$ 137.2M 3rd Qtr FY 07 $196.4M -70.1M $126.3M Income Sources Using ActivitiesCash Generated From Operations Notes: Data presented was adjusted to remove external income from operating programs and to align overhead expenses.
MWR Program FunctionalNAF Operating Results • NIBD includes interprogram adjustments Notes: FY04 – 07 Percentage based on UFM/USA for MWR - Adjusted Revenue.
Total MWR NAFIs YTD Jun FY07 NIBD and Local CPMC/NAFMC Execution ($000)