PORTO ALEGRE BRAZIL
530 likes | 832 Vues
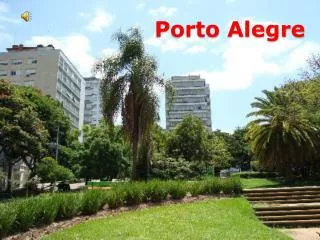
PORTO ALEGRE BRAZIL. The State. The City. Population. Rio Grande do Sul State 9.623.201 Metropolitan Region 3.235.925 Porto Alegre 1.286.251 Women 684.501 Men 601.750 Average Annual Growth in Porto Alegre 0,36 Demographic Density (inhab./km.²) 2.737

PORTO ALEGRE BRAZIL
E N D
Presentation Transcript
Population Rio Grande do Sul State9.623.201 Metropolitan Region 3.235.925 Porto Alegre 1.286.251 Women 684.501 Men 601.750 Average Annual Growth in Porto Alegre0,36 Demographic Density (inhab./km.²)2.737 Average Annual Growth in the State1,04 Souce: IBGE/1996
Economy Gross National Product (GNP) 1997 - em R$ State 68 bilhões Regional27 bilhões City 9,9bilhões Source: Fundação de Economia e Estatística
CITY HALL OF PORTO ALEGRE STRUCTURE AND DUTIES
THE CITY HALL • 26 thousand public workers • active: 21,830 retired: 5, 326 • Population of 1,288.881 inhabitants • Area of 50,000 hectares.
I P T U (Tax on Urban Properties) • Unpaid: • before the OP: 20 % • today: 12 % • Participation on Collecting: • before the OP: 6 % • today: 13 %
Impact of PB on Own Source Revenue in constant 1998 R$ millions YEAR TOTAL 1993 133,1 1994 154,7 1995 192,2 1996 209,2 1997 226,3 1998 236,7
Participative Budget • Geografic andThematic Base • Dynamics of Process • Financial Results
Participative Budget GEOGRAPHIC BASE The city is divided in 16 Regions THEMATIC BASE • Thematic Meetings(5) • Public Transport and Traffic • Health Care and Social Assistance • Education, Culture and Leisure • Economic Development and Taxation • City Organization and Urban Development
Participative Budget(PB) DYNAMICS OF PROCESS 1st Meeting • Investment Feedback • Investment Plan Presentation • Criterion and Method For PB • Community Representantive Election
Participative Budget Dynamic and Working Process Intermediate Meeting INTERMEDIATE MEETINGS • Governmental Organs provide technical information • discussion and selection of thematic priorities and regional works • Priorities of services, sectoral policies and works • Election of community representatives 2nd MEETING • Election of the Budget Council • Presentation of the receipt and expense estimates • The 16 regions and 5 thematic meeting hand in the priorities and works
PARTICIPATIVE BUDGET DYNAMICS AND WORKING PROCESS PROPOSAL ELABORATION • Inauguration of new Participative Budget Council • Course on Public Budget with the COP • Seminar on Public Budget with the community representatives • Reconciliation of regional and thematic priorities according to budget constraints • Discussion and Elaboration of Budget Proposal • Hand over of Budget Proposal to Municipal Council • Discussion and elaboration of Investment Plan
PARTICIPATIVE BUDGET ARRANGEMENT 2 Councils per city region = 32 titular members 2 Understudy Councils per city region = 32 understudy members 2 Thematic Plenary Councils = 10 titular members 2 Understudy Councils /Thematic Plenary = 10 understudy members 1 Community representative from Porto Alegre’s Inhabitantes Association 1 Representative from the Union of Municipal Public Workers 2 Members from the government with no-voting rights
REGIONS AND THEMES DEFINE PRIORITIES First priority Grade 4 Second priority Grade 3 Third priority Grade 2 Fourth priority Grade 1
SERVICE NEEDS AND INFRA-STRUCTURE Relative value 3 Up to 25%.................................................grade 1 From 26% to 50%...............................….grade 2 De 51% a 75%..........................................grade 3 De 76% on...........................................….grade 4
POPULATION OF EACH REGION Relative value 2 Up to 49.999....………......................…grade 1 From 50.000 to 99.999…….……......…grade 2 From 100.000 to 199.000...…………...grade 3 Over 200.000 ……............……….....…grade 4
THEMATIC PRIORITY OF REGION Relative value 3 From the fourth priority on.........................nota 1 Terceira prioridad........................................nota 2 Segunda prioridad........................................nota 3 Primera prioridad.........................................nota 4
Community Participation and Redistributive Public Expense Participatory Budget: changes in investment priorities since 1989 • Water System: from 83% to 98% coverage • Sewer System: from 46% to 85% coverage • Paving : from 4 to 20-30 Km/year • Doubled number of school enrollments • Reconstruction of 80 health care units
Investment Plan for 1999 Settled Priorities by the PB· Sanitation · Street Paving · Popular Housing · Education · Health
Principal Infrastructure Works • Programa de Desenvolvimento Municipal – III Perimetral • Projeto Corredor Norte e Nordeste • Ampliação de Avenidas Estruturais • Projetos Saneamento e Habitação
1999 Budget Total Budget : R$ 1,1 billon Investments: R$ 174,0 millons Source: City Hall of Porto Alegre - 1999
The Quality Of Life Porto Alegre Brazil Life Expectancy 70,3 yrs. 61,8 yrs. Education 97% 84% Garbage Collection100% 64,5% Sewer Coverage83% 42% Treated Sewer 44% n/d Water Supply99% 73,4% Electric Power98% 87,8% Childhood Death p/ 1,000 inhab. 15 37,5 Source: IBGE, SSMA/RS, PMPA and CEEE
Budgeting Balance 1998 Budget Surplus: R$ 24 million Source: City Hall of Porto Alegre - 1999