Download
1 / 22
220 likes | 361 Vues
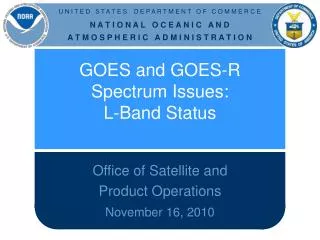
Co-registration of Band 2 versus Band 4 GOES-13 Imager A Comparison of “Sampling Values” Ranging from 0.40 to 0.66. A.J. Schreiner, T.J. Schmit, & J.P. Nelson III. 31 Oct 2012. Introduction.

E N D
Co-registration of Band 2 versus Band 4 GOES-13 Imager A Comparison of “Sampling Values” Ranging from 0.40 to 0.66 A.J. Schreiner, T.J. Schmit, & J.P. Nelson III 31 Oct 2012
Introduction The following set of slides looks at the difference between Band 2 and Band 4 of the GOES-13 Imager for a series of different “Resampling Values” as defined in detail by Zhenping Li in his Power Point entitled “GOES-IR Channel to Channel Co-Registration Algorithm and Implementation” (14 October 2012). The “Resampling Values” used in the following comparison are 0.40, 0.45, 0.50, 0.55, 0.60, and 0.66. This final value of “0.66” was originally generated by Zhenping Li for the GOES-13 date and time of 14 September 2012 (2012258) at 11:15UTC. In this example only Band 2 and Band 4 are compared over three different clear regions. Two of the regions lie along the upper Missouri River in North and South Dakota, and a third region covers lower Lake Michigan. The 11:15UTC time period was chosen for two reasons. First, the mis-registration is at a maximum at this time and Band 2 (3.9 µm) is not affected by sunlight at this time of year over the Great Lakes region and the upper Midwest. Therefore the difference between the two bands in clear regions is minimal and the brightness temperatures can be similar. The three regions were chosen because of the large relative difference between land and water temperature in these clear regions and because they are readily visible in the satellite imagery. Therefore, the statistical difference (i.e. standard deviation) between the two bands in these boxes should be small, if they co-register properly or exactly. The following slide delineates the three areas of interest.
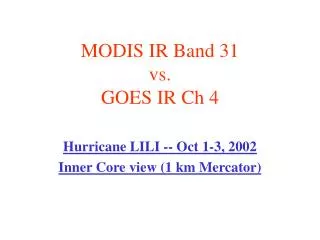
GOES-13 Imager Band2 (3.9 µm) – Band4 (10.5 µm) 14 Sep 2012 (2012258) 11:15UTC
Missouri River Comparison Band2 – Band4 GOES-13 14 Sep 2012 (2012258) 11:15UTC Resample value of: Original, 0.40, 0.45, 0.50, 0.55, 0.60, 0.66 Data Points/Max/Min/Std. Dev. for both boxes
732 7.02K -4.98K 1.396 2,706 7.02K -6.00K 1.071 -10K 0K 10K Band2 (Original) – Band4 (Original)
732 4.98K -3.96K 1.098 2,706 4.04K -3.02K 0.784 -10K 0K 10K Band2 (Original) – Band4 (0.40)
732 4.98K -3.02K 1.084 2,706 4.04K -2.00K 0.782 -10K 0K 10K Band2 (Original) – Band4 (0.45)
732 4.04K -3.02K 1.098 2,706 4.04K -2.00K 0.786 -10K 0K 10K Band2 (Original) – Band4 (0.50)
732 4.04K -3.02K 1.123 2,706 4.04K -2.00K 0.794 -10K 0K 10K Band2 (Original) – Band4 (0.55)
732 4.04K -3.96K 1.140 2,706 4.04K -2.00K 0.810 -10K 0K 10K Band2 (Original) – Band4 (0.60)
732 4.04K -3.96K 1.185 2,706 4.04K -2.00K 0.841 -10K 0K 10K Band2 (Original) – Band4 (0.66)
Summary of “Missouri River” Boxes Original 0.40 0.45 0.50 0.55 0.60 0.66 Missouri River: North Dakota Data Points: Max Diff: Min Diff: Std. Dev.: 732 7.02K -4.98K 1.396 732 4.98K -3.96K 1.098 732 4.98K -3.02K 1.084 732 4.04K -3.02K 1.098 732 4.04K -3.02K 1.123 732 4.04K -3.96K 1.140 732 4.04K -3.96K 1.185 Missouri River: South Dakota Data Points: Max Diff: Min Diff: Std. Dev.: 2,706 7.02K -6.00K 1.071 2,706 4.04K -3.02K 0.784 2,706 4.04K -2.00K 0.782 2,706 4.04K -2.00K 0.786 2,706 4.04K -2.00K 0.794 2,706 4.04K -2.00K 0.810 2,706 4.04K -2.00K 0.841
Lake Michigan Comparison Band2 – Band4 GOES-13 14 Sep 2012 (2012258) 11:15UTC Resample value of: Original, 0.40, 0.45, 0.50, 0.55, 0.60, 0.66 Data Points/Max/Min/Std. Dev.
728 4.98K -3.96K 1.452 -10K 0K 10K Band2 (Original) – Band4 (Original)
728 4.98K -3.96K 1.366 -10K 0K 10K Band2 (Original) – Band4 (0.40)
728 4.98K -3.96K 1.371 -10K 0K 10K Band2 (Original) – Band4 (0.45)
728 4.98K -3.96K 1.375 -10K 0K 10K Band2 (Original) – Band4 (0.50)
728 4.98K -3.96K 1.390 -10K 0K 10K Band2 (Original) – Band4 (0.55)
728 4.98K -3.96K 1.402 -10K 0K 10K Band2 (Original) – Band4 (0.60)
728 4.98K -3.96K 1.437 -10K 0K 10K Band2 (Original) – Band4 (0.66)
Summary of “Missouri River” & “Lake Michigan” Boxes Original 0.40 0.45 0.50 0.55 0.60 0.66 Missouri River: North Dakota Data Points: Max Diff: Min Diff: Std. Dev.: 732 7.02K -4.98K 1.396 732 4.98K -3.96K 1.098 732 4.98K -3.02K 1.084 732 4.04K -3.02K 1.098 732 4.04K -3.02K 1.123 732 4.04K -3.96K 1.140 732 4.04K -3.96K 1.185 Missouri River: South Dakota Data Points: Max Diff: Min Diff: Std. Dev.: 2,706 7.02K -6.00K 1.071 2,706 4.04K -3.02K 0.784 2,706 4.04K -2.00K 0.782 2,706 4.04K -2.00K 0.786 2,706 4.04K -2.00K 0.794 2,706 4.04K -2.00K 0.810 2,706 4.04K -2.00K 0.841 Lake Michigan Data Points: Max Diff: Min Diff: Std. Dev.: 728 4.98K -3.96K 1.452 728 4.98K -3.96K 1.366 728 4.98K -3.96K 1.371 728 4.98K -3.96K 1.375 728 4.98K -3.96K 1.390 728 4.98K -3.96K 1.402 728 4.98K -3.96K 1.437
Summary, Questions, and Further Work • Based on the three limited comparisons of three boxes for one day (14 Sep 2012) and time period (11:15UTC) it appears that a “Resample Value” of either 0.40 or 0.45 provides the best co-registration correction. (This is also based on the six different “Resample Values”.) • Improvement is shown in co-registration for both horizontal and vertical oriented features. (at a “Resample Value” of 0.45) • For the “Lake Michigan” Box improvement is also seen, but this time the improvement is best with a “Resample Value” of 0.40 (smallest Std. Dev.). • It appears that “Resample Values” of less than 0.60 show continued improvement. Is it possible that “Resample Values” of less than 0.40 might show even better co-registration? • For the moment we have focused on 14 Sep 2012. Is it possible to look at another day? Specifically, the days in question are 14 & 15 May 2012 (2012135 & 2012136) for GOES-13. These two days provided a clear example of co-registration problems around 10UTC to 15UTC. • At CIMSS additional work will be performed using the current suite of “Resample Values” to generate cloud mask/cloud top pressure products. This may provide additional feedback on the “best” “Resample Value”.