Understanding Simple Rational Functions and Hyperbolas in Graphing
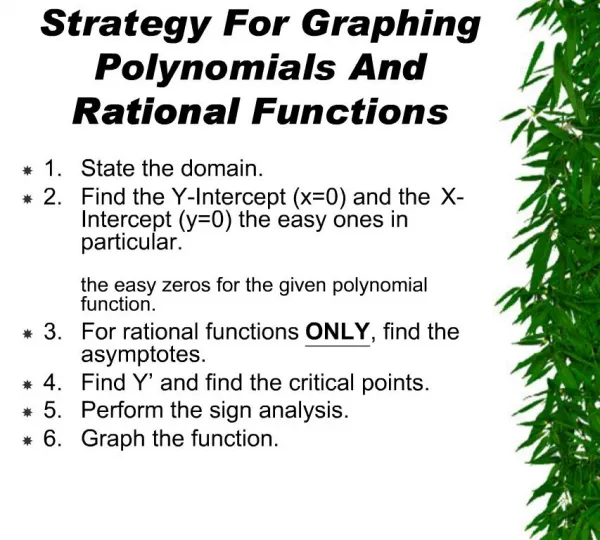
This guide introduces simple rational functions, focusing on hyperbolas characterized by vertical and horizontal asymptotes. A rational function takes the form p(x)/q(x), where p(x) and q(x) are polynomials and q(x) ≠ 0. We will explore two forms of hyperbolas, each possessing one vertical and one horizontal asymptote. Step through the graphing process, including finding asymptotes, plotting points around the asymptotes, and determining the domain and range. This concise overview is essential for mastering graphing simple rational functions.

Understanding Simple Rational Functions and Hyperbolas in Graphing
E N D
Presentation Transcript
Rational Function • A function of the form where p(x) & q(x) are polynomials and q(x)≠0.
Hyperbola x=0 • A type of rational function. • Has 1 vertical asymptote and 1 horizontal asymptote. • Has 2 parts called branches. (blue parts) They are symmetrical. We’ll discuss 2 different forms. y=0
Hyperbola (continued) • One form: • Has 2 asymptotes: x=h (vert.) and y=k (horiz.) • Graph 2 points on either side of the vertical asymptote. • Draw the branches.
Hyperbola (continued) • Second form: • Vertical asymptote: Set the denominator equal to 0 and solve for x. • Horizontal asymptote: • Graph 2 points on either side of the vertical asymptote. Draw the 2 branches.
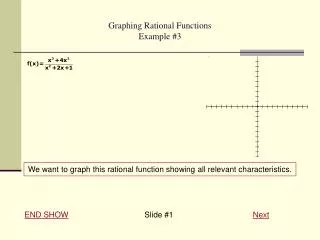
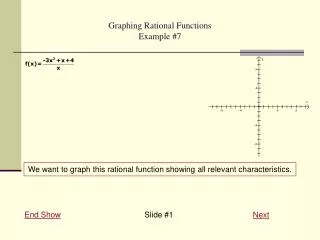
Ex: Graph State the domain & range. Vertical Asymptote: x=1 Horizontal Asymptote: y=2 x y -5 1.5 -2 1 0 -1 4 3 Left of vert. asymp. Right of vert. asymp. Domain: all real #’s except 1. Range: all real #’s except 2.
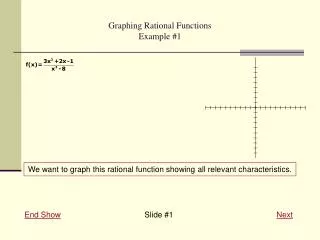
Ex: GraphState domain & range. Vertical asymptote: 3x+3=0 (set denominator =0) 3x=-3 x= -1 Horizontal Asymptote: x y -3 .83 -2 1.33 0 -.67 2 0 Domain: All real #’s except -1. Range: All real #’s except 1/3.