Download
1 / 34
340 likes | 507 Vues
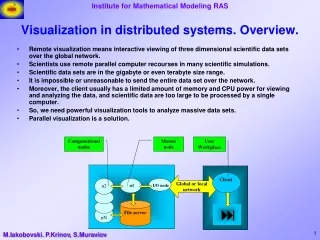
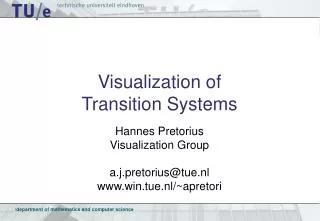
Visualization of Transition Systems. Hannes Pretorius Visualization Group a.j.pretorius@tue.nl www.win.tue.nl/~apretori. Outline. Transition systems Motivation Existing results Process Experiment 1: projection Experiment 2: simulation Experiment 3: clustering General conclusions.

E N D
Visualization of Transition Systems Hannes Pretorius Visualization Group a.j.pretorius@tue.nl www.win.tue.nl/~apretori
Outline • Transition systems • Motivation • Existing results • Process • Experiment 1: projection • Experiment 2: simulation • Experiment 3: clustering • General conclusions
Transition systems • Used to analyze and verify systems • Explicit descriptions of system behavior: • All system states • Transitions between these • Describe systems whose states evolve over time
Motivation • Facilitate insight: • Tools and techniques to understand systems • Address size and complexity • “Gestalt”: • Associate visual form with abstract formalism • Enhances communication
Motivation • Frank van Ham’s FSMView: • Shows global structure and symmetries • New approaches: • FSMView excels at what it was designed for • Investigate techniques with more focus on attributes (data, transition labels, …) • More interaction
Specify Σ Simulate Validate Process Formalspecification Real world LPE LTS
Specify Σ Simulate Validate Experiment 1: projection
[1,1,0,2] [2,2,1,0] [1,1,2,1] Experiment 1: approach • Data communication • Data is stored • States: vectors of data values • Multidimensional points
Experiment 1: approach Overview(dims) Visual mapping Visual mapping Visual mapping Selectsubset Data 2Dprojection
Experiment 1: overview State s1 s2 s3 a b c d Dimension
s3 s1 s2 Experiment 1: projecting to 2D
Experiment 1: results • Identify: • Superfluous variables • Correlations spanning multiple dimensions • States with specific valuations of variables • Phases of behavior • Interaction: • Coupling of two views important • “Data-centric” view: • Does not reveal enough about behavior
Specify Simulate Validate Experiment 2: simulation
Experiment 2: approach • Simulation: • Quick and incremental checking of specification • Text-based output: • Time consuming analysis • Not intuitive • Prone to human error
Experiment 2: approach • Automated parking garage • Custom plug-in: • Maps current system state onto 2D floor plan • Visual cues: • Lift position • Status of parking space (free, occupied,…) • Status of shuttles
Experiment 2: visual mapping Conveyor belt Lift Shuttle Occupied Free
Experiment 2: results • Efficiency of analysis: • Saves time • Intuitively clear and easy to follow • Identified and corrected serious errors early on • Stakeholders: • Convinced colleagues of merit of visualization • Means to communicate abstract ideas to client • Shows behavior
Specify Σ Simulate Validate Experiment 3: clustering
Experiment 3: approach • Directed graph: • Reduce size and complexity • Associate meaning with states and transitions: • Reduce in meaningful way • Ability to take behavior into account
Experiment 3: initial ideas • Linear representation: • Predictable • Suggests ordered analysis • Effective way to show patterns • Initial clustering: • Ranking (BFS, DFS) • Based on local behavior (fan-in, fan-out of transition labels at every state)
Experiment 3: approach • Every state is annotated: • Tuple with coordinates • Every coordinate has associated type • Every type has a domain • Partition states based on equivalence relation: • Select subset of coordinates • Cluster domain of associated type
Experiment 3: approach Data Clustered data Cluster Visual mapping Define eq. rel. Eq. rel Vis. Selection info. Select
Experiment 3: approach First partitioning: coordinate i Original transition system
Experiment 3: approach Second partitioning: coordinate j Original transition system
Experiment 3: approach • Allows for clustering based on: • Existing attributes • Derived attributes(structural properties, equivalence classes, …) • Construct hierarchy of clusters
Experiment 3: results • Definition of equivalence relation on the fly: • Select subset of components • Cluster type domains • Assumption: • User associates meaning with components • Combination of clusters and hierarchy promising • Work in progress: • Interaction • Derived attributes (behavior-related)
General conclusions • Experiments: • Gap between abstract and real world • Address sub-problems • Better understanding of problem (focus on behavior, clustering more general, …) • Looking ahead: • Include insights in current tool • Add more functionality to current tool (annotation, selection, may- and must-transitions)
General conclusions • Open questions: • How to move from one clustering to the next • Simulation works really well, how to generalize? • User requirements ? ?