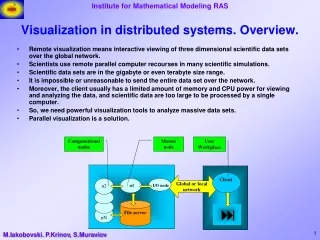
Interaction in Visualization Systems
Interaction in Visualization Systems. CPSC 533C Presentation Zhangbo Liu (Zephyr) December 7, 2005. Question to this topic: What & Why?. Interaction. “Interaction involves the transformations that map the data to visual form.”

Interaction in Visualization Systems
E N D
Presentation Transcript
Interaction in Visualization Systems CPSC 533C Presentation Zhangbo Liu (Zephyr) December 7, 2005
Question to this topic: What & Why?
Interaction • “Interaction involves the transformations that map the data to visual form.” • More than just controls? Integrates controls into the visualization. • Allows for direct manipulations of the graphical representation of the data.
Examples Ware, Chapter10, Information Visualization Ahlberg & Shneideman, The Film Finder Chuah et al., SDM Munzner,H3
Papers • High interaction graphics. Stephen G. Eick and Graham J. Wills. European Journal of Operational Research, 81:445-459, 1995. • Interactive Visualization of Genealogical Graphs. Michael J. McGuffin and Ravin Balakrishnan. Proc. InfoVis 2005.
Papers • High interaction graphics. Stephen G. Eick and Graham J. Wills. European Journal of Operational Research, 81:445-459, 1995. • Interactive Visualization of Genealogical Graphs. Michael J. McGuffin and Ravin Balakrishnan. Proc. InfoVis 2005.
High Interaction Graphics • ClarityInformation only on demand, cleaner & more focused displays, allow a range of options • RobustnessAvoid drawing inferences from only one view • PowerCombine views, leverage exploration • Possibility3+ dimensional data, animation
Principles • Simple, easy to interpret views • Information Hiding • Direct Manipulation • Linking & Brushing
Linking and Brushing • Linking • Visually showing which parts of one data plot correspond to that of another. • Brushing • Allowing the users to move a region (brush) around the data display to highlight points which fall within this region.
Examples Linking altitude to grass and grain types in Scottish Districts Districts of the city of Dublin showing areas with high levels of average income Slide adapted from Marti Hearst
Critique • Pros: • Very good survey paper for introduction, general techniques. • Easy to read. Seems like the beginning of a book. • Cons: • Examples were somewhat simple, despite mentioning some complex application domains. • Dated. Open issues are easy nowadays.
Papers • High interaction graphics. Stephen G. Eick and Graham J. Wills. European Journal of Operational Research, 81:445-459, 1995. • Interactive Visualization of Genealogical Graphs. Michael J. McGuffin and Ravin Balakrishnan. Proc. InfoVis 2005.
Problem Family trees are difficult to draw
Proposed solution • Dual-tree based representation
User Study • 1 practicing genealogist • 1 hour session • Neural feedbacks, no pros or cons
Critique • Pros: • A nice solution for a generally misunderstood graph drawing problem • Cool interaction technique for collapsing or expanding subtrees • Cons: • Requires some background in genealogy • Poor user study
![[ Contemporary Video Game Design. ] Challenges in Visualization Interaction and Simulation](https://cdn0.slideserve.com/1088677/contemporary-video-game-design-challenges-in-visualization-interaction-and-simulation-dt.jpg)