Machine Learning Introduction
Machine Learning Introduction. Course logistics (1). Course: CSS 581, Introduction to Machine Learning course website: http://courses.washington.edu/css581/ Instructor: Jeff Howbert email: peaklist@u.washington.edu (preferred) phone: (206) 669-6629 [ cell ] office: UW1-040

Machine Learning Introduction
E N D
Presentation Transcript
Course logistics (1) • Course: CSS 581, Introduction to Machine Learning • course website:http://courses.washington.edu/css581/ • Instructor: Jeff Howbert • email: peaklist@u.washington.edu (preferred) • phone: (206) 669-6629 [ cell ] • office: UW1-040 • office hours: to be determined • faculty website:http://faculty.washington.edu/peaklist
Course logistics (2) • Exercises • about 7 over quarter • mix of problem sets, hands-on tutorials, minor coding • 25% of grade • Projects • 3 projects • each 25% of grade • Grading will be on a curve
Course logistics (3) • Textbook: Introduction to Data Mining, Pang-Ning Tan, Michael Steinbach, and Vipin Kumar, Addison-Wesley, 2006 • Programming language: MATLAB • For both exercises and programming projects • Available on CSS departmental Linux machines • Student license $99, plus $29 for Neural Network toolbox
Goals for course • Primary • Hands-on experience with a variety of common machine learning techniques and application domains • Enough grounding in theory to design applications and interpret results intelligently • probability, statistics • Secondary • Hands-on experience with a high-level scientific computing language • Ability to implement working code directly from a mathematical specification
Machine learning Broad definition: Automated discovery of patterns in data by a computer. This is learning, because computer is given an initial pattern-recognition model and some data, and figures out how to make the model better. This is machine, because computer learns automatically, without intervention from humans (other than selection of initial model and data).
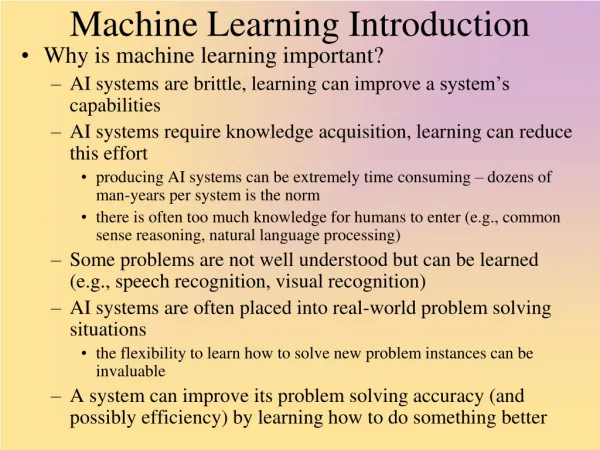
Why is machine learning important? • Data in many domains is huge • Thousands to billions of data samples • Hundreds to millions of attributes • Impossible for human analysts to see patterns across so much data • Patterns in many domains are subtle, weak, buried in noise, or involve complex interactions of attributes • Often very difficult for human analysts to find • In some domains discovery and use of patterns must happen in real time, e.g. in streaming data • Human analysts could never keep up
Machine learning applications (1) • Commercial • Targeted marketing: understand purchasing patterns of individuals or groups • web-based advertising • Recommender systems: help people find items they will like • Fraud detection • Finance • Predict movements in markets • Portfolio risk management
Machine learning applications (2) • Natural language processing • Speech recognition • Machine translation • Document classification and retrieval (books, email, web pages) • Sentiment analysis • Computer vision • Optical character recognition • Face recognition • Image classification and retrieval
Machine learning applications (3) • IT • Network intrusion detection • Spam filtering • Robotics • Manufacturing process control • Social media
Machine learning applications (4) • Scientific • Remote sensing networks:atmosphere, ocean, fresh-water,land-based, satellite • weather and climate modeling • environmental management • resource management • Biomedical: gene sequencing,gene expression, epidemiology,disease prediction
Machine learning careers • A.k.a. predictive analytics, business analytics, data mining, data science, quantitative modeling • Demand continues to outstrip supply • Not necessary to have Ph.D. • For every “analyst” position, there are several tightly allied positions in software dev, engineering, databases, cloud, etc. • In demand with local employers • Amazon, Google, Microsoft, Facebook, Zillow • Fred Hutchinson Cancer Research Center, many labs at University of Washington • Many smaller companies, including startups
Demo: Google Goggles ..\videos\Google Goggles.wmv on web: http://www.youtube.com/watch?v=Hhgfz0zPmH4 http://www.youtube.com/watch?v=8SdwVCUJ0QE http://techtalks.tv/talks/54457/
Demo: autonomous helicopter flight ..\videos\Autonomous_Helicopter_Stanford_University_AI_Lab.flv on web: http://heli.stanford.edu
Demo: Xbox Kinect motion capture ../videos/kinectresearch.mp4 on web: http://www.dailymotion.com/video/xhvql0_kinectresearch-mp4_videogames http://techtalks.tv/talks/54443/
Related and overlapping fields • Machine learning is coalescence of ideas drawn from artificial intelligence, pattern recognition, statistics, and data mining • These days: • Pattern recognitionand machine learningessentially the same • Data mining is machinelearning plus large-scaledata retrieval methods • Machine learning is oneof the hot research frontiersin statistics pattern recognition statistics machine learning artificial intelligence data mining
Patterns Transformed data Data Target data Stages of knowledge extraction Interpretation / evaluation Knowledge Machine learning Transformation Preprocessing Selection Preprocessed data
Types of machine learning • Supervised methods (“predictive”) • Build a predictive model from examples of data with known outcomes. • Use model to predict outcomes for unknown or future examples. • Unsupervised methods (“descriptive”) • Discover structure in data for which outcomes are not known.
Machine learning tasks Supervised • Classification • Regression • Recommender systems • Reinforcement learning Unsupervised • Clustering • Association analysis • Ranking • Anomaly detection We will cover tasks highlighted in red
Classification definition • Given a collection of records (training set) • Each record contains a set of attributes. • Each record also has a discreteclass label. • Learn a model that predicts class label as a function of the values of the attributes. • Goal: model should assign class labels to previously unseen records as accurately as possible. • A test set is used to determine the accuracy of the model. Usually, the given data set is divided into training and test sets, with training set used to build the model and test set used to validate it.
Test set Model Classification illustrated categorical categorical continuous class Training set Learn classifier Predicted classes
Classification application 1 • Direct marketing • Goal: Reduce cost of mailing by targeting a set of customers likely to buy a new cell-phone product. • Approach: • Use the data for a similar product introduced before. • We know which customers decided to buy and which decided otherwise. This {buy, don’t buy} decision forms the class label. • Collect various demographic, lifestyle, and company-interaction related information about all such customers. • Type of business, where they stay, how much they earn, etc. • Use this information as input attributes to learn a classifier model. From [Berry & Linoff] Data Mining Techniques, 1997
Classification application 2 • Customer attrition: • Goal: To predict whether a customer is likely to be lost to a competitor. • Approach: • Use detailed record of transactions with each of the past and present customers, to find attributes. • How often the customer calls, where he calls, what time-of-the day he calls most, his financial status, marital status, etc. • Label the customers as loyal or disloyal. • Find a model for loyalty. From [Berry & Linoff] Data Mining Techniques, 1997
Classification application 3 • Sky survey cataloging • Goal: To predict whether a sky object is a star or a galaxy (class), especially visually faint ones, based on telescopic survey images from Palomar Observatory. • 3000 images with 23,040 x 23,040 pixels per image. • Approach: • Segment the image. • Measure image attributes (features) - 40 of them per object. • Model the class based on these features. • Success story: Found 16 new high red-shift quasars – very distant objects, very difficult to identify. From [Fayyad, et.al.] Advances in Knowledge Discovery and Data Mining, 1996
Classification application 4 Classify galaxies according to stage of formation:early, intermediate, or late Early • Attributes: • Image features • Characteristics of light waves received • etc. Intermediate Late • Data size: • 72 million stars, 20 million galaxies • Object catalog: 9 GB • Image database: 150 GB Courtesy: http://aps.umn.edu
Classification application 5 C-Path: automated pathologic grading of breast cancer specimens • Started with 6642 high-level features per image • Features characterized both malignant epithelium and surrounding stroma • Algorithm simultaneously selected small subset of features and learned to discriminate 5-year survivors from non-survivors • Final model: 11 features, 89% accuracy on predicting 5-year survival Science Translational Medicine, 3, 108ra113, 2011
Clustering definition • Given: • Set of data points • Set of attributes on each data point • A measure of similarity between data points • Find clusters such that: • Data points within a cluster are more similar to one another • Data points in separate clusters are less similar to one another • Similarity measures: • Euclidean distance if attributes are continuous • Other problem-specific measures
Types of clustering • Partitional • Data points divided into finite number of partitions (non-overlapping subsets) • Hierarchical • Data points arranged in tree structure that expresses a continuum of similarities and clustering
Partitional clustering illustrated Euclidean distance based clustering in 3D space Intracluster distances are minimized Assign to clusters Intercluster distances are maximized
Hierarchical clustering illustrated Driving distances between Italian cities
Clustering application 1 • Market segmentation • Goal: subdivide a market into distinct subsets of customers, such that each subset is conceivably a submarket which can be reached with a customized marketing mix. • Approach: • Collect different attributes of customers based on their geographical and lifestyle related information. • Find clusters of similar customers. • Measure the clustering quality by observing buying patterns of customers in same cluster vs. those from different clusters.
Clustering application 2 • Document clustering • Goal: Find groups of documents that are similar to each other based on the important terms appearing in them. • Approach: Identify frequently occurring terms in each document. Form a similarity measure based on the frequencies of different terms. Use it to cluster. • Benefit: Information retrieval can utilize the clusters to relate a new document or search term to clustered documents.
Document clustering example • Items to cluster: 3204 articles of Los Angeles Times. • Similarity measure: Number of words in common between a pair of documents (after some word filtering).
Clustering application 3 • Image segmentation with mean-shift algorithm • Allows clustering of pixels in combined (R, G, B) plus (x, y) space
Clustering application 4 • Genetic demography
Association rule definition • Given: • set of records each of which contain some number of items from a given collection • Produce dependency rules which will predict occurrence of an item based on occurrences of other items. Rules Discovered: {Milk} --> {Coke} {Diaper, Milk} --> {Beer}
Association rule application • Supermarket shelf management • Goal: Identify items that are bought together by sufficiently many customers. • Approach: Process the point-of-sale data collected with barcode scanners to find dependencies among items. • A classic rule … • If a customer buys diaper and milk, then he is very likely to buy beer. • So don’t be surprised if you find six-packs stacked next to diapers!
(A B) (C) (D E) (A B) (C) (D E) <= xg >ng <= ws <= ms Sequential pattern definition • Given is a set of objects, with each object associated with its own timeline of events, find rules that predict strong sequential dependencies among different events. • Rules are formed by first discovering patterns. Event occurrences in the patterns are governed by timing constraints.
Sequential pattern applications • Telecommunications alarm logs (Inverter_Problem Excessive_Line_Current) (Rectifier_Alarm) --> (Fire_Alarm) • Point-of-sale transaction sequences Computer Bookstore: (Intro_To_Visual_C) (C++_Primer) --> (Perl_for_dummies,Tcl_Tk) Athletic Apparel Store: (Shoes) (Racket, Racketball) --> (Sports_Jacket)
Regression definition • Given a collection of records (training set) • Each record contains a set of attributes. • Each record also has a continuousresponse variable. • Learn a model that predicts response variable as a function of the values of the attributes. • Model can be linear or nonlinear. • Goal: model should predict value of response variable on previously unseen records as accurately as possible. • Usually, the given data set is divided into training and test sets, with training set used to build the model and test set used to test its accuracy.
Regression application 1 • Estimate market value of homes • Data from multiple sources • Physical attributes • Tax assessments • Prior sale prices • Data from home ofinterest, plus homesin same neighbor-hood, city, state
Regression applications 2 • Predict voting patterns inelections. • Predict sales volumeof new product basedon advertisingexpenditure. • Predict weather patternsas a function oftemperature, humidity,air pressure, etc. • Time seriesprediction of stockmarket indices.
Recommender system definition DOMAIN: some field of activity where users buy, view, consume, or otherwise experience items PROCESS: users provide ratings on items they have experienced Take all < user, item, rating > data and build a predictive model For a user who hasn’t experienced a particular item, use model to predict how well they will like it (i.e. predict rating)
Recommender system application 1 Amazon.com product recommendations
Recommender system application 2 Netflix viewing recommendations
Recommender system application 3 • Social network recommendations of essentially every category of interest known to mankind • Friends • Groups • Activities • Media (TV shows, movies, music, books) • News stories • Ad placements • All based on connections in underlying social network graph and the expressed ‘likes’ / ’dislikes’ of yourself and your connections
Anomaly detection • Detect significant deviations from normal behavior • Applications: • Credit card fraud detection • Network intrusion detection Typical network traffic at University level may reach over 100 million connections per day
Challenges of machine learning • Data often has poorly understood structure • Best modeling approach rarely obvious at start • Heterogeneous data types • e.g. combination of text, images, and numeric data • Frequent class imbalance • Noisy or corrupted data • Missing or incomplete data • High dimensionality • Scaling of algorithms to massive data sets • Streaming (real-time) data
Schedule for rest of course • Review schedule in syllabus • Sequence of lecture topics • Topics for programming projects