Download
1 / 22
220 likes | 320 Vues
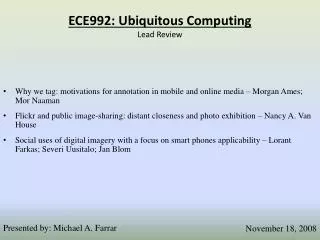
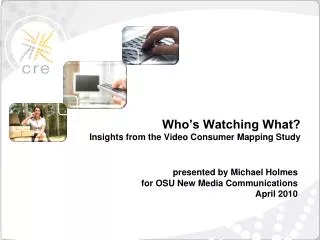
presented by Michael Holmes for OSU New Media Communications April 2010. Who’s Watching What? Insights from the Video Consumer Mapping Study. The media world is more complex than ever. 2010 Broadcast TV Cable TV Satellite TV IPTV DVR AM & FM radio Satellite radio Internet radio

E N D
presented by Michael Holmesfor OSU New Media CommunicationsApril 2010 Who’s Watching What? Insights from the Video Consumer Mapping Study
The media world is more complex than ever 2010 Broadcast TV Cable TV Satellite TV IPTV DVR AM & FM radio Satellite radio Internet radio Mobile video Smart phone SMS texting Newspapers Magazines (17k+) E-mail Web browsing Social media Streaming media Desktop widgets CD, MP3 Movies VCR, DVD, VOD Telephone Mobile phone VoIP phone Instant messaging Online gaming Game consoles Handheld games Postal mail Books etc. 1970 Broadcast TV Cable TV AM & FM radio Newspapers Magazines (10k+) Movies Vinyl records Cassette tape Reel-to-reel tape Telephone Postal mail Books
1970 2010 24 24 Hours in the day
The VCM study helps the media industry face this challenge The Nielsen Company Council for Research Excellence Media Consumption and Engagement Committee of the CRE
The CRE asked for a snapshot of the media world Dimension current consumption of media—focusing on television and video—and how it is changing over time in order to Guide video media audience measurement by Mapping the current media ecosystem
We responded to the research challenge A consumer-centric media insight and R&D facility Mike Bloxham Director, I&R Michael Holmes Associate Director A brand and media metrics consultancy Bill Moult Founding partner Jim Spaeth Founding partner
A large sample was used Core DMAs in yellow Acceleration DMA in red Seattle, WA Philadelphia, PA Chicago, IL Indianapolis, IN Atlanta, GA Dallas, TX Image from Google Earth™
The analysis focuses on the screen ecosystem 2nd 1st Computer Screen TV Screen 4th 3rd TextMessage All Other Screens Mobile Screen
The dominance of the screen ecosystem has been noted in some of the nation’s foremost news sources.
Live TV Daily reach: 94%Avg. daily duration: 331 mins Users: Daily reach Total Usage = Daily reach X Daily duration 94% X 331= 311 avg. mins per ALL Core participants including non-users spent with Live Television Usage per User: Average daily duration 14
DVDs Followed by DVR Playback Were by Far the #2 And #3 Sources of Video After Live TV DVD/VCR players matched DVR on duration, but were higher on daily reach.
How consumers accumulated screen time varied with age Average Daily Minutes, Core Sample, N=752 observed days, Spring and Fall 2008 All participants, including non-users of various media, including concurrent exposure Except for those 45-54, 4-screen totals all add to 8½ hrs +/-2% How Consumers Accumulated Their Screen Time Average Daily Minutes, Core Sample, N=752 observed days, Spring and Fall 2008 All participants, including non-users of various media, including concurrent media exposure By age group By age group Environmental /Other video: 4min Environmental /Other video: 4min Mobile other (e.g. camera, etc): 0.5min Mobile other (e.g. camera, etc): 0.5min IM: 8min GPS navigation: 2min Mobile talk: 17min Mobile web: 1min Live TV: 309min In-Cinema movie: 2min GPS navigation: 2min Web: 49min Live TV: 309min In-Cinema movie: 2min Computer video: 2min Mobile web: 1min Playback via DVR: 15min DVD or VCR: 23min Playback via DVR: 15min Console games: 7min DVD or VCR: 23min Web: 49min IM: 8min Mobile talk: 17min Console games: 7min Computer video: 2min Email: 37min Email: 37min Mobile text: 2min Mobile text: 2min Software: 46min Mobile video: 0.1min Software: 46min Mobile video: 0.1min 8hrs 18mins 8½ hrs – 2% It is widely recognized that those 65+ are heavy users of Live TV 8hrs 32mins 8½ hrs Among those 55+ time with email declines substantially and IM disappears Among those 55+ time with email declines substantially and IM disappears 9hrs 34mins 9½ hrs + 1% DVR playback is highest among those under 55 DVR playback is highest among those under 55 Those 45-54 use TV like those older but computer like those younger 8½ hrs + 1% 8hrs 33mins Web use is highest for those under 45 Web use is highest for those under 45 8½ hrs 8hrs 31mins DVD use is highest among those18-34 DVD use is highest among the 18-34 Computer and environmental video small and mainly among those under 25 8hrs 30mins 8½ hrs 1st screen 2nd screen 3rd 4th 1st screen 2nd screen 3rd 4th 4th screen 4th screen 2st screen 2st screen 3rd screen 3rd screen 1st screen 1st screen Total 4th screen: 8min Total 4th screen: 8min Total 1st screen: 353min Total 1st screen: 353min Total 2nd screen: 143min Total 2nd screen: 143min Total 3rd screen: 20min Total 3rd screen: 20min
TV screen, computer screen and audio account for about 90% of media exposure Audio Landline phone 4th screen 1st screen 2nd screen Newspapers 3rd screen Magazines Average Daily Minutes, Core Sample, N=752 observed days, Spring and Fall 2008All participants, including non-users of various media, including concurrent media exposure . By age group Screen media Other major media Avg. 353min (48%) Avg.143min (20%) Avg. 20min (3%) Avg: 8min(1%) Radio Avg. 84min(11%) Avg.14min (2%) Avg. 6min (1%) Avg: 25min (3%) Other Audio 80min(11%)
Age groups vary in their platform promiscuity Using a 10 minute average as a cut off Those 18-24 are exposed to twice as many screen media 10+ mins as those 65+ (10 vs. 5); greater media diversity
Key Findings Summary Composition of consumers’ screen media time varied across age groups but total screen time was strikingly similar except among those 45-54, whose screen time was highest. The degree of concurrent screen media exposure (media multitasking) was equivalent for all age groups under 55. Even among those 18-24, TV represented more than 98% of video exposure. Live TV led all video time by a large margin, followed by DVDs, with DVRs third. The study suggests computing has displaced radio as the number 2 media activity. Radio is now 3rd and print 4th.
Key Findings Summary New HDTV ownership led to higher TV exposure, though some of this increase appeared to be temporary (and driven by sports). Early DVR owners spent more time with DVR playback that new DVR owners. A higher percentage of TV time was spent as sole medium compared to computers, print or audio. DVR playback time was even more likely than live TV to be as sole medium. TV users were exposed to, on average, roughly an hour a day of live TV ads and promos. Caution needs to be applied in interpreting self-report data for media use. TV was substantially under-reported while online video and mobile video usage were over-reported.
Reports and presentations are available on the sponsor’s site: www.researchexcellence.com Contact: Mike Bloxham, mbloxham@bsu.edu Michael Holmes, mholmes@bsu.edu