Download
1 / 12
120 likes | 245 Vues
The Cosmic Dust Experiment (CDE) has been established to monitor cosmic dust flux variability using an impact detector. This measurement is essential for understanding dust input into the mesosphere. Calibration has been rigorously performed at LASP and involves electronics and PVDF detectors, ensuring accurate charge to mass conversion. The CDE meets its scientific requirement of 100 hits per week, with a noise floor significantly below the threshold, verifying its readiness for integration into processing software. CDE is primed for launch, meeting all science objectives.

E N D
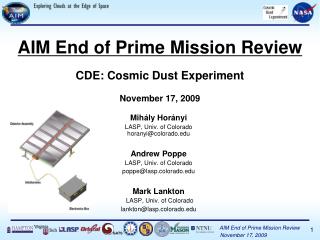
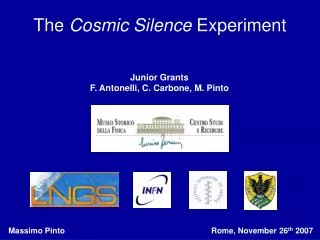
Cosmic Dust Experiment (CDE)Science and Calibration David James University of Colorado/LASP 303-492-5208 david.james@lasp.colorado.edu
Science Goals Monitor the cosmic dust flux variability : CDE measures dust flux using an impact detector. Measurement at S/C is directly related to dust input to the mesosphere.
Dust Detection using PVDF Depolarization induced current PVDF Film Al/Ni Contacts
Calibration and Validation Plan • Calibration is performed in two steps: • Electronics (DN to charge) • Performed at LASP 9/16-9/20 • PVDF Detectors (Charge to mass, given velocity) • SDC calibration with dust accelerator in Heidelberg, Germany is complete • Proposed CDE calibration in early 2006
E-box Calibration • Calibration of Electronics was performed at LASP before (abbreviated) and after the environmental (full) testing • Tested full dynamic range of each signal chain 104-1010e charges at 21 individual values (100 events at each of the 21 values injected externally). • Tested over full range of E-box temperatures (-26 to 50oC) • Full calibration at -26, 0, 15, 30, 50°C • Pre-Environmental Calibration at 20oC • Repeated for all 14 channels • Total Calibration generated 14 x 5 x 21 = 1476 data sets of 100 hits.
Calibration Setup – External Charge Injection Environmental Chamber Injection Circuit to Simulate Detector Signal Data Collection
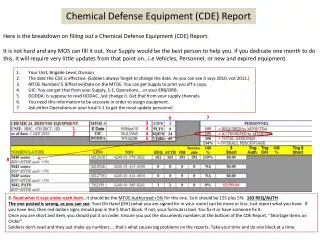
CDE will maximize impact rates CDE detector area ~ 0.1 m2 300 hits/day @ 0.1 m threshold 3 hits/day @ 1.0 m threshold Science requirement: 100 hits/week → 0.7 m threshold mass
PVDF Detectors 100 hits/day 15 km/s To meet science requirement of 100 hits/week must have a noise floor of 106 electrons. 10 13 100 hits/week on ~ 0.1 m2
CDE Noise Characterization Noise floor well below required 106 electrons. CDE satisfies its science requirements! 9*105 e level
Calibration Summary • Charge injection calibration has been completed and is ready for integration into ground processing software • Determination of noise floor via zero threshold noise collection verifies that CDE meets science requirements • CDE is ready to ship and meets science requirements