Download

1 / 21
210 likes | 397 Vues
An Ultra-High-Energy Cosmic Ray Experiment. Glenn Sembroski QuarkNet Summer Workshop July 24,2012. The Big Question Which has become the Big Mystery. Where do Cosmic Rays come from? A multi-part question. i.e. Lots of small mysteries Different answers for different energy regimes

E N D
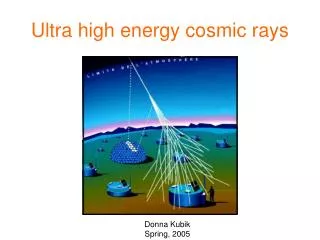
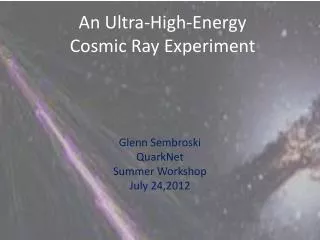
An Ultra-High-Energy Cosmic Ray Experiment Glenn Sembroski QuarkNet Summer Workshop July 24,2012
The Big QuestionWhich has become the Big Mystery Where do Cosmic Rays come from? A multi-part question. i.e. Lots of small mysteries Different answers for different energy regimes Different answers for different Cosmic-Ray particle types
Measured spectrum has lots of features which raise questions: • Why does the spectrum follow a power law: Energy - alpha where alpha is typically around 2.5? • Why is there a “Knee”? • Why is there an “Ankle”? • Is there a cutoff at ultra-high energies, and if so why there and not lower(GZK effect)? • Just how can you make Cosmic Rays of ultra high energies? Charged Cosmic Rays
How was this spectrum measured? • Depends on energy range • Taken ~100 years • Balloon born detectors • Rocket born detectors • Satellite born detectors • Ground base detectors • All use different/same techniques and methods. Another Question
Concentrate on the highest energy cosmic rays. What do we know? Too Many Questions
Lots of structure. • Why does the spectrum not continue? • Why does it NOT stop at the GZK cutoff (next slide)? • What can be the source? • Is there a time dependence? • A direction dependence? • Galactic source or Extra-Galactic. Not so many Questions
At very high energies, a proton can “collide” with a low energy photon • The universe is full of low energy photons • the cosmic microwave background radiation • Very (and Ultra) high energy protons can’t travel very far without interacting with the CMB photons Greisen-Zatsepin-Kuzmin (GZK) cutoff
It has been proposed that cosmic rays with energies <3 x 10¹⁸ev are galactic in origin (or at least “local”) • Above this energy random deflections by the galactic magnetic fields are ineffectual in changing CR direction. • Above 3 x 10¹⁸evpresently measured CR do NOT appear to come from the galactic plane but appear to come from random directions in the sky. (Well, maybe random..) GZK Mystery
GZK effect implies that all CR with energies above 1020 ev from extra-galactic sources would be “scattered” down to energies below 1020 ev. • However, we have seen anumber of CR with energies above 1020 ev . • Solution: We Need More Data! GZK Mystery cont.
From original CR spectrum plot, CR intensity above 1018ev is ~1particle/km2/year • We need a really big detector. • Satellites are way to small” ~1m2 • We need a detection area the size of Rhode Island — over 3,000 km2 (1,200 sq mi) — in order to record a large number of these events. • That sounds very expensive! Pierre Auger Observatory
But we can take advantage of the fact that energetic particles entering the earth’s atmosphere create particle cascades. • A 1020eV particle creates a cascade with many millions of particles spread over an area of up to 16 sq km. • The atmosphere is part of the detector. • Large spread of particles allows us to “sparsely” sample the showers. Pierre Auger Observatory cont.
Pierre Auger Observatory cont. • Auger has 1600 10m sq surface detectors (SD) spread over 3000 sq km • SD Detectors are place on a grid with 1.6 km spacing. • Array is in a desert in remote, dark, isolated, arid area of Argentina. • Can see Galactic center.
Second detector system consists of 4 atmosphere shower track florescence detectors overlooking SD array. Pierre Auger Observatory cont.
Uses “Water Cherenkov” technique to detect charged shower particles. • V=C charged particle generates Cherenkov light (mostly blue) when going through water • Water in SD has area 10m2, Depth of 1.2 m • 3- 9 inch diameter PMTs view water volume. • Can detect individual muons. Auger Surface Detector (SD)
Trigger requires 3 fold coincidence between pmts at 1.75 single muon pulse height (TH-T1 trigger). • Second stage of trigger is Time-Over-Threshold trigger (TOT-T2). • TOT requires 2 of 3 pmt’s with coincident pulses > 300 ns long. Insures we have a real shower. Auger SD Trigger and Data Acquisition
T2 Trigger along with time-stamp sent to central data acquisition station (CDAS). • A T3 array trigger is formed in the CDAS • T3 requires coincidence of 3 SD T2 triggers. • Also requires the 3 SD are “neighbors” • Produces about 1600 events /day. • Upon declaration of T3 , CDAS requests event data from relevant SD’s and stores for later offline analysis. Auger SD Trigger and Data Acquisition cont.
Offline analysis uses measurement (and fitting) to lateral distribution of particle density to estimate energy of shower. • Timing information used to estimate shower (and thus primary) direction. • Stereo Florescence detectors also provide energy and direction info but only have 13% live time (moonless nights). • Note that simulations are used to “calibrate” the analysis. • Thus there is probably some unknown systematic error in the energy estimation. Auger Data Analysis
Data Taking began in 2004. • Array completed in 2008 • As of 2011 Auger detected > 64000 events with energies above 3 x 10 18ev • >5000 events with energies above 10 19ev • Highest energy seen from Auger is ~ 2.1 X 10 20ev. With an uncertainty of ~ 25 % Auger Data Results
No statistically relevant correlation found to AGN or other extra galactic sources. • No clustering found • No correlation with galactic sources found. Auger Data Results cont.
AMIGA:AugerMuons and Infill for the Ground Array • 30 m2 plastic scintillators buried ∼ 3.0 m underground • Infill detector: Addition of SD on a graded fine scale spacing 433,750 and 1500 m apart. Auger Improvements
prototype radiotelescope array (AERA — Auger Engineering Radio Array) for detecting radioemission from the shower cascade • Auger North? Colorado/Kansas Auger Improvements cont.