Analytic Strategies for the OAI Data
270 likes | 503 Vues
Analytic Strategies for the OAI Data. Charles E. McCulloch, Division of Biostatistics, Dept of Epidemiology and Biostatistics, UCSF. December 6, 2007. Outline. Introduction and examples. General analysis considerations. Accommodating correlations between knees within a person

Analytic Strategies for the OAI Data
E N D
Presentation Transcript
Analytic Strategies for the OAI Data Charles E. McCulloch, Division of Biostatistics, Dept of Epidemiology and Biostatistics, UCSF December 6, 2007
Outline • Introduction and examples. • General analysis considerations. • Accommodating correlations between knees within a person • Accommodating correlations over time • Analyzing change. • Questions from the participants.
Introduction • Analysis technique depends on nature of the outcome variable and research question. • Binary: logistic regression (e.g., presence of osteophytes) • Odds ratios, area under ROC curve • Numeric: linear regression (e.g., WOMAC pain) • Also – time to event (Cox model or pooled logistic regression), count outcomes (Poisson regression) • Methods need to be modified if there are clustered data or repeated measures.
Prototypical examples Example 1: (cross sectional) Is KOOS quality of life related to BMI at baseline? Example 2: (clustered by knee) Is difference between men and women in the WOMAC pain score the same for those with and without symptomatic knee OA at baseline?
Prototypical examples Example 3: (clustered data) Is the presence of osteophytes at baseline predicted by knee pain? Example 4: (longitudinal/change) Is the 18 month change in WOMAC pain score the same or different for those with symptomatic knee OA at baseline?
Ex 1: Is KOOS QoL related to baseline BMI? Analysis: linear regression. Regression coefficient is -1.01 with a SE of 0.08 and a p-value of <0.0001. Not clustered data.
Potential classes of research questions • Classify diseased/non-diseased individuals [Diagnostic, Burden]. • Predict onset or progression of disease [Prognostic]. • Model/predict change over time [Efficacy of Intervention]. [Biomarker classification from Bauer, et al, 2006]
Accommodating clustered or repeated measures data • Important to accommodate clustering and repeated measures. • Otherwise SEs, p-values and confidence intervals can be incorrect, sometimes grossly so. • Not possible to predict how the results will change when the proper analysis is used.
Efficiency of analyses of clustered data • For between person predictors (e.g. BMI), the proper, clustered-data (e.g.,outcome measured on two knees) analysis will usually have larger SEs. • Intuition: for between person predictors an analysis that assumes all knees are independent over-represents the information content. • For within person predictors (e.g., knee-specific), the proper, clustered-data analysis will usually have smaller SEs. • Intuition: Using each person as their own control increases efficiency.
Ex 2: Is there a sex by baseline SX OA interaction for the WOMAC pain score? When analyzing knees, effect of failing to allow correlation between a person’s knees
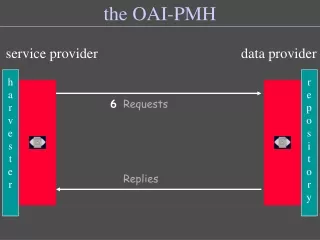
Accommodating clustered or repeated measures data • Many methods exist to accommodate • Mixed models (e.g., SAS Proc MIXED, NLMIXED) • Repeated measures ANOVA (e.g., SAS Proc GLM) • Alternating logistic regression (in SAS Proc GENMOD) • Generalized Estimating Equations (GEEs). Invoked in SAS using Proc GENMOD using the REPEATED statement.
Accommodating clustered or repeated measures data • Repeated measures/clustering is an issue for the outcome variable, not the predictor. • Example: Are days missed from work predicted by knee pain (separate values for left and right knee). Does not have repeated measures on the outcome. • Can accommodate by including both left and right knee values as predictors or by calculating summary measure(s) (e.g., average knee pain).
Desirable features for an analysis method • Can accommodate a variety of outcome types (e.g., binary and numeric). • Can accommodate clustering by knee, person (over time) and perhaps even different regions of interest (ROI) within a knee. • Does not require extensive modeling of the correlation over time or between knees or between ROI in the knee.
Recommended analysis strategy - GEEs • Works with many types of outcomes. • Robust variance estimate – obviates need to model correlation structure. • Works well with not too many repeated measures per subject and a large number of subjects. • So ideal for analyses incorporating multiple knees and time points. Somewhat less good if there are also multiple ROI per knee treated as outcomes (e.g., tibial and femoral cartilage loss).
Recommended analysis strategy - GEEs • Accommodates unbalanced data, e.g., some subjects contribute one knee while others contribute two. • Accommodates unequally spaced data, e.g., missed visits. • BUT – always be wary of the pattern of missing data. If the fact that the data are missing is informative (e.g., those with missed visits are in extreme pain), virtually no standard statistical method will get the right answer.
Ex 2: Is there a sex by baseline SX OA interaction for the WOMAC pain score? Effect of different analysis methods:
Ex 2: Does pain predict presence of osteophytes at baseline? The odds of an osteophyte increase by 12.5% with each increase in pain score of 1 (0-10 scale). Odds ratio of 1.125 (95% CI 1.102, 1.149). Accounts for clustering by subject.
Analyzing change with longitudinal data • Including a variable for time (or visit) describes the change over time, e.g., progression. • Inclusion of time (or visit) interactions with baseline predictors allows analysis of whether baseline predictors are associated with change over time. • Inclusion of a time-varying predictor (e.g., MRI findings at sequential visits) allows analysis of whether change in that predictor is associated with change in the outcome.
Analyzing change with longitudinal data • Can use lagged variables to ask if prior values of risk factors predict later onset of disease (Is it prognostic?) • Helps to strengthen inference of causation.
Ex 3: Does 18 month change in WOMAC pain depend on baseline SX K OA? Include a SX K OA by visit interaction in the model.
Analyzing change over time: What about analyzing change scores? • An excellent and simple method when there are only two time points of interest and most subjects have complete data. • Not as attractive with multiple time points or unbalanced data. Some loss of efficiency. • If you do analyze change scores, be very wary of adjusting for baseline values of the change scores. Doing so will usually bias estimates of change.
Analyzing change over time: What about analyzing change scores?
Analyzing change over time: What about analyzing change scores? • Using a longitudinal analysis the difference in change (BL to 12 month visit) between the OA and non-OA groups is 0.268 with a SE of 0.1333 and a p-value of 0.045. • Using the change score analysis the difference is 0.264 with a SE of 0.1339 a p-value of 0.049.
Data layouts for longitudinal/clustered data For longitudinal analyses: “long format”
Data layouts for longitudinal/clustered data For change score analyses: “wide format”
Questions and Answers? Contact information: chuck@biostat.ucsf.edu