Download
1 / 17
200 likes | 356 Vues
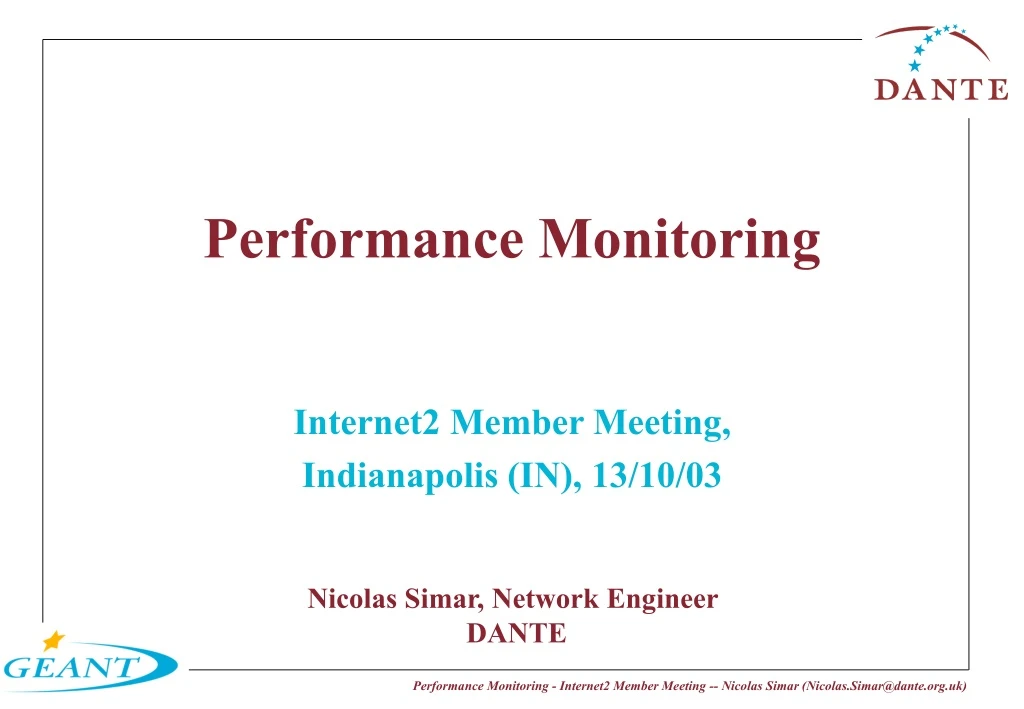
Performance Monitoring. Internet2 Member Meeting, Indianapolis (IN), 13/10/03. Nicolas Simar, Network Engineer DANTE. What is it?. Multi-domain Network Performance Measurement Management Platform Retrieve network information from several domains through a pre-defined interface.

E N D
Performance Monitoring Internet2 Member Meeting, Indianapolis (IN), 13/10/03 Nicolas Simar, Network Engineer DANTE
What is it? • Multi-domain Network Performance Measurement Management Platform • Retrieve network information from several domains through a pre-defined interface. • Performance Monitoring: monitoring of network characteristics such as delay, packet loss, available bandwidth, “traceroute”, etc • extended to looking glass functionality • netflow like data (to track DoS attack)
What is it? • Multi-domain Network Performance Measurement Management Platform • Management platform • Provide an “aggregated/concatenated” view of the information retrieved. • Available bandwidth R1 -> R2 = x Mbps ; R2 -> R3 = y Mbps ; R3 -> R4 = z Mbps • Available bandwidth R1 -> R4 = min(x,y,z) Mbps • Enable users to generate traffic and select the traffic characteristics. • <IP (destIP, tos, size, etc); TCP/UDP (port, etc)> • Allow to retrieve information out of several domains. • In this presentation, the term “user” refers to an user of the management platform.
PERT - network of people aiming at addressing the end-to-end performance problem. We need to provide them tools (to analyse the network). PERT stands for Performance Emergency/Enhancement Response Team (http://www.dante.net/tf-ngn/pert/) - starting phase. Users (European National Research and Educational Networks - NREN) and their users (GRIDs, researchers) are requesting more and more networks statistics. Where does the project come from?
Overview • Objectives • Exchange monitored data between domains to • Ease the troubleshooting • Give to the network users (for instance end-site systems administrator or advanced network users) more information about networks-edge to network-edge performances (later on, host-to-host or host-to-network for end-users). • Network/service health verification. • SLA verification. • Re-usable parts (as much as possible). • Must be able to cope with new type of tests/network characteristics.
Building blocks • Measurement Point (MP) • “anything” (router, piece of software, etc) capable of providing information about network characteristics (delay, routing info, interface status, etc) • For a given type of measurement, different type of MPs can be used. (e.g. delays, RIPE TTM on GÉANT, Deacon on Cesnet, OWAMP on Abilene). • Inter-Operability Issues (I-OI #1) (active packet format, etc). • I-OI stands for Inter-Operability Issues. These are the ones which need to be addressed globally by all the parties.
Building blocks • Interface • Present network information from a domain, under a pre-defined format (I-OI #2), to the outside world. • The information can be a single value (or a set of values) grouped as being a characteristic of network element and/or per time interval. • The interface could also presents concatenated information coming from several domains. • Allows to start measurements (I-OI #3) from/to MPs not under our administrative authority.
Building blocks • Domain tool/Measurement broker • High level functionality: negotiate tests, collects the data, concatenates them (if requested), aggregates them (if requested) and/or analyses them (if needed). • Lower level functionality: • Interrogates the “path finder” about which MPs and which domain tools have to be contacted. • Aggregation, concatenation, contact the MPs and other domains. • Schedules tests, do resource management on behalf of the MPs, negotiate test with other domains. • Authentication, authorisation. • Format data according to predefined format.
Building blocks • Path Finder • High level functionality: find out the measurement nodes along a path or the closest to a given IP address. • Two cases • the full path is given • only end points are given • trickier • Could also provide the domain measurement nodes capabilities. • Historical path variation difficult to provide • Implies limitation concerning the end-to-end information which can be provided. • Work lead by SWITCH (Switzerland).
Building blocks • Authentication/Authorisation • High level functionality: allows to authenticate a user and to map the user against a (defined) class of user. • e.g. domainX.NOC or domainX.end-user (among other possible). • This will allow the user to get the data he is authorised to access and/or to start tests based on its authorisation level. • e.g. domainX.NOC can access any data and start test up to x Mbps ; domainX.end-user can access a restricted set of information. • Privileges negotiation between domains (I-OI #6).
Working areas • Tests/metric definition (I-OI #1). • Domain interface. (I-OI #2, I-OI #3, I-OI #4, I-OI #5, I-OI #6) • Path finder (I-OI#4). • Measurement protocol (I-OI #1, I-OI #3). • User representation and statistics. • Data storage, retrieval and analyses. • Domain tool architecture. • Domain tool implementation. • Measurement box guidelines. • Trial.
Trial • One-way type of tests (use of RIPE TTM boxes) • cannot start a new test with RIPE TTM. • GARR (Italy), GÉANT (European Backbone), HEANET (Ireland) and SWITCH (Switzerland). • GARR, SWITCH and HEANET already have some RIPE TTM boxes. Three RIPE TTM boxes are being installed on GÉANT. • Analyser module (v0.3) and interface not completely implemented. • Interface still requires some more specifications. • Need to add a security section to the performance monitoring activity.
Future GN2 • GN2 is the project name from which the GÉANT2 network will be built. • In the GN2 proposal, the performance activity is foreseen as being a Joint Research Activity -JRA- between the Europeans NRENs and DANTE. • GN2 starting Q3 2004 • For the performance monitoring JRA, the NREN have committed to provide the equivalent of 10 full time equivalent for the duration of the project - 4 years. • budget for the deployment of around 30 boxes within GÉANT and the NRENs.
Information • URLs • http://www.dante.net/tf-ngn/perfmonit/ • http://chx400.switch.ch/mailman/listinfo/perfmonit