Enhancing Road Performance Monitoring through Integrated Watershed and Road Management Strategies
This initiative focuses on the importance of efficient and effective road performance monitoring within the context of watershed management. It highlights the variations in road performance and how failure sites help define performance thresholds and risks over time. Utilizing logistic regression modeling applied to historical failure datasets, it aims to provide specific risk assessments related to road-related landslides. By integrating DSR attributes into INFRA, road managers can better understand failure types, causes, and their impacts on surrounding ecosystems, ultimately improving road management practices.

Enhancing Road Performance Monitoring through Integrated Watershed and Road Management Strategies
E N D
Presentation Transcript
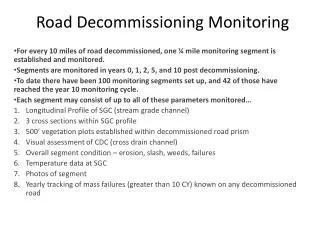
Monitoring Road-Watershed Performance An Initiative for Efficient and Effective Road Performance Monitoring: Combine effort to complete DSRs and INFRA to achieve road performance monitoring mj furniss, PNW. 2005
Roads are a focus of watershed monitoring • But roads vary greatly in performance • Most do not fail • Failures tend to cluster in areas of inherent instability
Why? • Failure sites create a useful dataset for defining road performance through time • Failures define the limits of practice in various landscape situations • When experienced road managers retire, mission-critical knowledge could be conserved
Why? • Little added effort for substantial value returned • INFRA in place and working • DSRs completed • Related monitoring
What you get • Ability to determine thresholds of performance • Ability to determine relative risk of failure • Quantitative description of risks
Calawah R. N. Fk. Headwaters Pistol Cr. Bonidu Cr.
Use Topograpy to Define Landscape Types for Chi-square Analysis Slope:<=15%, 15-30%, 30-45%, >45%Slope Position:<=20%, 20-55%, 55-85%, 85-100%Distance to Stream:<34m, 34-74m, 74-135m, <=135m
Chi-Square Results: Landscape types with fewer failures than expected were generally in gentler slope areas; those at lower slope positions and further from streams. Types with more failures than expected were generally at higher slope positions, steeper slopes, and closer to streams.
A Need for More Specific Risk Information Logistic Regression Modelling: • Combine 509 known failures with 1008 randomly selected locations. • Use slope, slope position, and stream proximity to estimate relative risk of road-related landslides.
Logistic Regression Model:ln(odds) = -1.8802 + 0.0238Slope + 0.0192Slope Position – 0.016Distance + 0.0001SlopeDistance
Slope 7% Slopos 4% Distance 27m Landslide Odds 19X Reference Segment 95% CL: 7, 51 Slope 23% Slopos 19% Distance 27m Landslide Odds 39X Reference Segment 95% CL: 15, 100 Reference Segment: Slope 3% Slpos 8% Distance 213m Relative Odds of Road-Related Landslides
127 167 17 72 73 65 50 53 Relative Odds Compared to 2% Slope, 2% Slope Position, 200m to Stream
How you get it… • Add DSR points and attributes to INFRA • Attributes of failure type, cause, coarse magnitude
How you get it • Modify description block in DSR to include: Failure type Cause Volume (quantity classes) • Total • To stream • To riparian area (within 50 m)
Cause Attributes…Questions • Perpetrator or innocent bystander? • Context • Impact Sometimes roads catch and preventsediment delivery
Other road monitoring Use categories created in this effort for consistency and combined analysis