Download

1 / 34
340 likes | 356 Vues
Learn about watershed monitoring, RMP structure, emerging contaminants, and strategies for monitoring pollutants in San Francisco Estuary. Discover data collection methods, prioritized management actions, and environmental impact assessments.

E N D
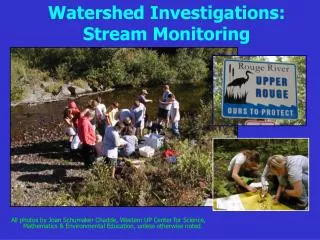
Watershed Monitoring and the RMP Lester McKee and Meg Sedlak Presentation to North Bay Watershed Association September 10th, 2010
Regional Monitoring Program • 17th Year • Budget and structure • Status and Trends • Storm water monitoring activities at SFEI
Budget and Fees • Funded by NPDES dischargers and dredgers • Total budget 2010: $3.2 million
RMP Structure Steering Committee Technical Review Committee Sources Pathways & Loading Exposure & Effects Emerging Contaminants Contaminant Fate
RMP Structure Steering Committee Technical Review Committee • South Bay Dischargers • Industry (USS POSCO Steel) • RWQCB Reg. 2 • City and County of SF • US Army Corps of Engineers Sources Pathways & Loading Exposure & Effects • WWTPs • Refineries • Stormwater Agencies • USEPA • City of San Jose Emerging Contaminants Contaminant Fate
Workgroups are where the rubber meets the road Steering Committee Technical Review Committee Sources Pathways & Loading Exposure & Effects Emerging Contaminants Contaminant Fate
Workgroups are where the rubber meets the road Steering Committee Technical Review Committee SPLWG Advisory Panel Dr. Barbara Mahler, USGS Dr. Eric Stein, SCCWRP Dr. Mike Stenstrom, UCLA Sources Pathways & Loading Exposure & Effects Emerging Contaminants Contaminant Fate
RMP Strategies • TRC • SC • WGs STRATEGIES
Small Tributary Loading Strategy Q1. Which are the high leverage small tributaries that contribute or potentially contribute most to Bay impairment by pollutants of concern? Q2. What are the loads or concentrations of pollutants of concern from small tributaries to the Bay? Q3. How are loads or concentrations of pollutants of concern from small tributaries changing on a decadal scale? Q4. What are projected impacts of management actions on load or concentrations of POC from high leverage small tributaries? Q5. Where should management actions be implemented in the region to have the greatest impact?
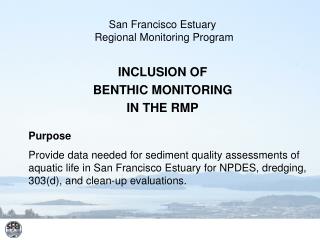
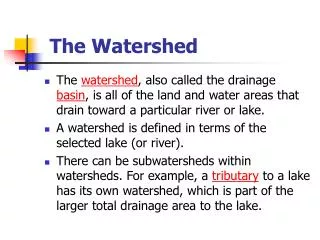
RMP Mission • Collect data and communicate information about water quality in the San Francisco Estuary to support management decisions
Guided by Management Questions • MQ1: Are chemical concentrations in the Estuary potentially at levels of concern and are associated impacts likely? • MQ2: What are concentrations and masses of contaminants in the Estuary and its segments? • MQ3: What are sources, pathways, loading, and processes leading to contaminant related impacts in the Estuary? • MQ4: Have the concentrations, masses, and associated impacts of contaminants in the Estuary increased or decreased? • MQ5: What are the projected concentrations, masses and associated impacts of contaminants in the Estuary?
How does the RMP answer MQs? • Status & Trends Monitoring (1993 - ) • Sediment and water (annually) • Bivalves (every 2 years) • Sport fish (every 3 years) • Bird eggs (every 3 years) • Pilot and Special Studies • Provides framework for adaptive • management • Responsive to changing needs
Status & Trends:Water and Sediment • 22 Water sites • Metals, PAHs, PBDEs, pesticides, & PCBs • Aquatic toxicity • Summer only • 47 Sediment sites • Metals, PAHs, PBDEs, pesticides and PCBs • Sediment toxicity • Wet/dry weather
Status &Trends: Monitoring of Biota • Bivalves, bird eggs, and sport fish
Information Dissemination • Pulse • Annual Meeting • October 5th, register on-line • Technical reports • Journal articles • Workshops
Presentation outline Overview • Where and how to we measure contaminant mass loads in stormwater? • How to we scale up from local scale to regional scale estimates? • How much contaminant mass gets into San Francisco Bay on average each year? • Which contaminants are our highest priority? Knowledge for managers: Tracking and abating - the PCB example • What did we use PCBs for? • Where are the contaminated areas? • How should treatment controls be designed to be effective for PCB?
Overview – Where have we been monitoring? • Sacramento River at Mallard Island • 154,000 km2 • WY 2002-2006, 2010 • Guadalupe River at Hwy. 101 • 400 km2 • WY 2003-2006, 2010 • Zone 4 Line A at Cabot Blvd. • 4.5 km2 • WY 2007-2010 • North Richmond Pump Station • 1.4 km2 • WY 2011 • San Pedro Road Stormdrain • 1 km2 • WY 2005 • Gellert Park Recreational Facility • 0.016 km2 • WY 2010 North Richmond Sacramento River Zone 4 Line A Gellert Park Guadalupe River San Pedro Stormdrain
Overview – Challenges of scale in monitoring? Zone 4 Line A (1.6 hrs) Guadalupe R. (8 hrs) Sacramento River At Mallard Island (3-4 days) Gellert Park Rec Facility (12 mins) North Richmond Pump Station (1.1 hrs) San Pedro Stormdrain (54 mins) (4 acres) (40 acres)
Sacramento River at Mallard Island USGS 15 minute Turbidity Sampling over 5-15 days during storms Sampling 4-7 storms per year Dayflow daily discharge Overview – How have we been monitoring?
Guadalupe River at Hwy 101 15 minute Turbidity Sampling over 3 -30 hours during storms Sampling 7-10 storms per year 15 minute discharge Overview – How have we been monitoring?
Zone 4 Line A in Hayward 5 minute Turbidity Sampling over 1-3 hours during storms Sampling 10-15 storms per year 5 minute discharge Overview – How have we been monitoring?
North Richmond Pump Station 5 minute Turbidity Sampling over 1-2 hours during storms Sampling 2 storms per year 5 minute discharge Overview – How have we been monitoring?
Overview – How do we scale up from local to regional? • PCB TMDL • Used loads measurements from Coyote Creek (WY 2005) and Guadalupe River (WY 2003-06), extrapolated them in time using monthly runoff data to derive a long term annual average load and scale up for urban area. • Future • Presently developing a spreadsheet model that will incorporate: • Rainfall • Land use / contaminant source • Impervious based runoff coefficients adjusted for slope and soil type • Land use / contaminant source specific contaminant concentrations • Hydrologic calibration for a range of Bay Area watershed types • Loads calibrated to measurements
Overview – Average annual mass load to San Francisco Bay? Mercury PCBs
Overview – Average annual mass load to San Francisco Bay? Annual Average Mass Loads (metric t) Source: Davis et al, 2000; McKee et al in prep interpolated for annual average and scaled for urban area
Knowledge for managers: Tracking and abating - the PCB example
Tracking and abating: What did we use PCBs for? Old factory transformers PG&E facilities Fluorescent light ballast Floor polish Household appliances Caulking
Summary and next steps • Municipal Regional Stormwater NPDES Permit (MRP) calls for: • Incorporate PCB-containing equipment inspection into exiting industrial inspections • Conduct pilot projects to evaluate managing PCB-containing waste materials during building demolition and renovation • Investigate on-land locations with contaminated soils • Conduct pilot studies to evaluate and enhance municipal sediment removal and management practices • Conduct pilot projects to evaluate on-site stormwater retrofit • Investigate diversion of dry-weather and stormwater flows to wastewater treatment • BASMAA EPA grant: “Clean Watersheds for a Clean Bay” • Select five watersheds an locate contaminated areas and refer these sites to regulatory agencies for cleanup and abatement • develop methods to enhance removal of sediment with PCBs during municipal sediment management activities • retrofit eight to 10 urban runoff treatment facilities into existing infrastructure • facilitate development and implementation of a regional risk reduction program