Download
1 / 60
600 likes | 758 Vues
Facts about Coastal Alabama’s Homeowners’ Insurance Crisis. and The Two Solution Strategies. It’s time to FIX this Crisis -- Not Dabble at it. ALABAMA RATE STATUTES. 1) The newly-passed S tate Clarity Law that focuses on non-discriminatory treatment of Alabama’s Coastal Counties.

E N D
Facts about Coastal Alabama’s Homeowners’ Insurance Crisis and The Two Solution Strategies. It’s time to FIX this Crisis -- Not Dabble at it
ALABAMA RATE STATUTES 1) The newly-passed State Clarity Law that focuses on non-discriminatory treatment of Alabama’s Coastal Counties • Alabama statute says that rates must not be: • * Excessive • * Inadequate • * Unfairly discriminatory 2) A Special Multi-State Coastal Insurance Band
The first strategy The new Alabama Insurance Clarity Law Let’s get a couple myths out of the way, first.
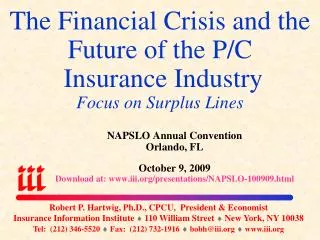
Despite the increase in natural disasters, the U.S. insurance industry was the richest it has ever been in March 2011. US Policyholder Surplus:1975–2011* ($ Billions) Surplus as of 6/30/11 was a near-record $559.1 down 1% from the record $564.7B as of 3/31/11, but up 27.9% ($122B) from the crisis trough of $437.1B at 3/31/09. Prior peak was $521.8 as of 9/30/07. Surplus as of 6/30/11 was 7.1% above 2007 peak. $560 Billion in “Net Worth” “Surplus” is a measure of underwriting capacity. It is analogous to “Owners Equity” or “Net Worth” in non-insurance organizations Dr. Robert Hartwig slide Source: A.M. Best, ISO, Insurance Information Institute. * As of 6/30/11.
Putting their $560 billion “net worth” in perspective. . . Pre-Tax Post-Tax EVENT2010 DOLLAR LOSS 1. Hurricane Katrina, August 2005 $45.5 billion $29.6 2. World Trade Center, Pentagon terrorist attacks, September 2001 22.9 14.9 3. Hurricane Andrew, August 1992 22.4 14.6 4. Northridge, California earthquake, January 1994 17.3 11.2 5. Hurricane Ike, September 2008 12.7 8.3 6. Hurricane Wilma, October 2005 11.4 7.4 7. Hurricane Charley, August 2004 8.5 5.5 8. Hurricane Ivan, September 2004 8.1 5.3 9. Hurricane Hugo, September 1989 6.7 4.4 10. Hurricane Rita, September 2005 6.2 4.0 The catastrophes were ranked by III based on size of loss in 2005 dollars, which we do not display here. What is displayed is the actual dollars in the year of the event. We calculate the post-tax figure by deducting the corporate tax rate of 35 percent. Source: Insurance Services Office (ISO); Insurance Information Institute (See http://www.iii.org/facts_statistics/catastrophes-us.html). (Ranked on constant dollar cost to insurers) . . . the cumulative, pre-tax cost of the Top 10 U.S. Catastrophes over the last 22 years totals $161.7 billion. (The post-tax total is $105.2 billion.)
They’re not broke. Another myth to get behind us . . .
156 “admitted” companies write Homeowners Insurance in Alabama. (485 are licensed to write it) • Who are Plan Members? • All licensed insurers writing P&C coverage insurance in Alabama • Current Members (Plan year 2011) • 485 Companies • 329 Exempt from participation • 306 write no P & C in AL • 156 Companies are subject to assessments ranging from .0001% up to 19.5546% • 69 Companies report voluntary written premium in eligible areas • 23 voluntarily write sufficient coastal property to be exempt from AIUA assessments 11/21/2011 Alabama Insurance Underwriting Association A lack of competition is not the problem
If Money’s not the Problem & and Competition’s not the problem? . . . What is The Problem?
The Problem: The Wildly Experimental Hurricane Catastrophe Models & an Alabama Department of Insurance (DOI) lack of information & bias . . . . . .that leads to unfair price discrimination against the Coastal Counties. The DOI assumes Alabama’s Coastal Counties are more expensive to repair due to wind-and-hail than the rest of the state. Significantly more.
In 2006, when this Crisis Started the coastal counties paid the State Average. The Alabama Average today is about $850 a year
Alabama Coastal Premiums today are 250 to 325% Higher than other Parts of the State. ALABAMA HOMEOWNERS RATES Average Premium Relativity (with Wind) by City for a $200,000 Home: Birmingham (35242) = 100% Huntsville (35801) = 110% Montgomery (36117) = 111% Tuscaloosa (35401) = 120% Camden (36726) = 135% Gadsden (35901) = 136% Dothan (36301) = 139% Saraland (36571) = 263% Mobile (36608) = 294% Bay Minette (36507) = 300% Fairhope (36532) = 311% Gulf Shores (36542) = 328% The DOI method understates the actual difference
In 2006 (the time of abundant news about Global Warming) The DOI decided Alabama’s coastal counties would be wildly more expensive to repair than the rest of the state. Warmer oceans would make hurricanes more frequent and damaging. So . . . The Alabama DOI allowed/ required Insurance Companies to introduce Wildly Experimental Hurricane Catastrophe Models in their price-setting. This is the Big Change
Coastal Insurance Prices skyrocketed 10,000s of Mobile and Baldwin Families were Dumped 10,000s of Coastal Families are Now Functionally Uninsured or have simply Dropped Their insurance Altogether. Some have Lost their Homes. $200 million premiums in excess of the State Average is siphoned out of our Two Counties each year. That’s a lot of Jobs.
Was the DOI right? Are Coastal Counties REALLY 300% more Expensive To Repair Than the Rest of the State? Let’s look at the evidence. ?
For starters, let’s be clear: Hurricane Catastrophe Models are NOT the Weather Channel predictions of a hurricane’s path.
Hurricane Catastrophe Models use formulas that estimate Tens of thousands of hurricane sizes & wind speeds, & deterioration over land, & their effects on roofs and walls, the effects of hills and valleys, future global warming, price surge after a catastrophe, and so on and predict . . .
How much it will cost to repair your house due to hurricane damage over the next 50,000 Years!
To date, they have never predicted the outcome accurately. Yet the Alabama DOI requires they be used to figure premiums in coastal Alabama
In 2006 The Wildly Experimental Hurricane Catastrophe Models predicted $60+ billion in US hurricane losses over the forthcoming 5 years (from 2006 – 2010)
Karen Clark – the Inventor of the Models – found that the actual losses were only $15 Billion. (The models overpredicted losses by $45 billion.)
In 2011 Risk Management Solutions (RMS) dramatically revised its Hurricane Catastrophe Model. (RMS is one of the modeling companies that predicted $60+ billion in coastal losses.)
Slide 52 taken from the RMS report given to Alabama DOI April 2011 -- their colored map shows the effects of their revisions. Their model had Overstated the costs in Mobile & Baldwin counties 50%. They Understated the costs inland by as much as 400%.
Karen, -- the Inventor of the Hurricane Catastrophe Models -- has Repudiated her Invention.
Is the Coast REALLY more Expensive to Repair than Inland? If not. . . then Coastal Alabama should pay the State Average like it always Paid In the Past $850 a year
As RMS figured out, when hurricanes strike Alabama’s coastal counties, they don’t stop at the county line. Hurricanes do significant inland damage, too.
FEMA declared 65 of Alabama’s 67 counties Disasters after Hurricane Ivan Alabama’s Disaster Counties after Hurricane Ivan Autauga, Baldwin, Barbour, Bibb, Blount, Bullock, Butler, Calhoun, Chambers, Chilton, Choctaw, Clarke, Clay, Coffee, Colbert, Coosa, Conecuh, Covington, Crenshaw, Cullman, Dale, Dallas, DeKalb, Elmore, Escambia, Etowah, Fayette, Franklin, Geneva, Greene, Hale, Henry, Houston, Jackson, Jefferson, Lamar, Lauderdale, Lawrence, Lee, Limestone, Lowndes, Macon, Madison, Marengo, Marshall, Marion, Mobile, Monroe, Montgomery, Morgan, Perry, Pickens, Pike, Randolph, Russell, Shelby, St. Clair, Sumter, Talladega, Tallapoosa, Tuscaloosa, Walker, Washington, Wilcox, and Winston Counties. Designated Counties for Alabama Hurricane Ivan Disaster Summary For FEMA-1549-DR, Alabama Declaration Date: September 15, 2004 Incident Type: Hurricane Ivan Incident Period: September 13, 2004 through September 30, 2004 Individual Assistance (Assistance to individuals and households): Public Assistance(Assistance to State and local governments for the repair or replacement of disaster-damaged public facilities): Autauga, Baldwin, Bibb, Bullock, Butler, Calhoun, Cherokee, Chilton, Choctaw, Clarke, Cleburne, Coffee, Colbert, Conecuh, Coosa, Covington, Crenshaw, Cullman, Dale, Dallas, Dekalb, Elmore, Escambia, Franklin, Geneva, Greene, Hale, Houston, Jackson, Jefferson, Lamar, Lawrence, Lee, Lowndes, Marengo, Marion, Marshall, Mobile, Monroe, Montgomery, Perry, Pickens, Pike, Shelby, Sumter, Talladega, Tallapoosa, Tuscaloosa, Washington, Wilcox, and Winston Counties for assistance for debris removal and emergency protective measures, including direct Federal assistance, at 100 percent Federal funding of the total eligible costs for a period of up to 72 hours. Hazard Mitigation Grant Program(Assistance to State and local governments for actions taken to prevent or reduce long term risk to life and property from natural hazards): All counties are eligible to apply for assistance under the Hazard Mitigation Grant Program. FEMA Disaster Summary For FEMA-1549-DR, Alabama Two-thirds of all claims after Ivan were made north of Mobile and Baldwin counties, according to a source cultivated by Alabama State Senator Trip Pittman.
Some hurricanes do more damage inland than on the coast.The eye of Hurricane Katrina, skipped Alabama’s coastal counties, curved from the Mississippi Coast back east to clip the northwestern corner of Alabama, the only part of the state that the “eye” touched.
Your tax money being spent for Katrina Relief in Tuscaloosa.
Mid-day – Aug 28 – Began to Dissipate 8:30am – Aug 26 – Landfall in LA 8:50am Aug 24 – Landfall in FL Hurricane Andrew behaved in a similar way
Hurricane data alone suggests inland Alabama incurs more wind losses than the models predict. And the models just deal with Hurricanes alone. What about Other Kinds of wind-and-hail events?
2011 Catastrophic Homeowners* Claim Activity in Alabama, by Event** Alabama suffered Five “Catastrophic” Wind or Hail events in 2011 – not just one. Four others in addition tothe April 27 Tragedy. It suffered significant wind damages in 2009, Too. # Claims HO $ % HO # % Total $ Pd. Perils Avg. Pmt $ Date Event Total 2011:Q1 Total Event Total Event Total Event Total 2011:Q2 Total Event Total 2011:Q3 Total 2011 YTD Totals **Through Dec, 7, 2011. Source: PCS Division of ISO. *Includes all categories of dwelling policies, such as home, condo and renters’ policies
“Alabama averaged 59 tornadoes each year from 2000-2010. . .” Tornado Tracks by Enhanced Fujita(EF) Scale, January – July 2011 Alabama averaged 59 tornadoes per year from 2000-2010, but 128 from Jan. – July 2011, the highest in the country AL had the highest concentration of EF-3, 4 and 5 storms in 2011 Source: NOAA at: http://www.spc.noaa.gov/wcm/2011-jan-jul.png 12/01/09 - 9pm eSlide – P6466 – The Financial Crisis and the Future of the P/C
Alabama averaged OneHurricaneevery 11 years (during the 20th Century) 59 (Tornadoes a Year) X 11 (Years between each Hurricane) = 649 Tornadoes per Hurricane
Severe Weather Reports in Alabama,January 1—December 5, 2011 In 2011 alone, in Alabama alone, there were 217 “severe” Hail reports 170 Tornadoes 901 other “severe” wind reports There were 1,288 severe weather reports in AL through Dec. 5 Source: NOAA Storm Prediction Center; http://www.spc.noaa.gov/climo/online/monthly/2011_annual_summary.html#
Are the Coastal Counties REALLY more expensive ? How do we answer that question?
Simple Compare the costs to repair the coastal counties with the cost to repair inland counties. So. Why not do this?
Because the Alabama Department of Insurance does not collect data on a county-by-county basis.
This is why the Clarity Act is so significant. It allows us to do the math. It requires the DOI to collect, aggregate, and publish on- line, by zip code and peril: a) dollar amount of claims b) dollar amount of premiums c) total number of Policies. This information makes it possible to compare coastal losses with inland losses.
ALABAMA RATE STATUTES Alabama Law & Policy requires that the DOI insure fair pricing practices. • Alabama statute says that rates must not be: • * Excessive • * Inadequate • * Unfairly discriminatory If Clarity Act data shows we’re not more expensive (or only 50% more expensive), then law and policy say that the DOI must prohibit “unfairly discriminatory” pricing statewide.
If the Clarity Act Data shows Mobile and Baldwin counties are not more expensive to repair, then the coastal counties should not pay more than the rest of the state. The $3,000 premium in Lake Forest should be reduced to the approximate level of the state average, that is . . . reduced from $3,000 a year to about $950 a year.
Action Step: You and all of us must monitor the production of the data and be prepared in November to speak to the need for non-discriminatory fairness. To do this, stay connected to HHII emails and/or meetings.
The Second Strategy The Special (Joe Faust or) Multi-state Coastal Reinsurance Band Keeping $48+ Billion at home
All experts agree that (a) the wildly-experimental hurricane catastrophe models and (b) the cost of reinsurance are the two factors driving our high wind insurance costs. The Alabama Clarity Law exposes the wildly experimental wind catastrophe models. The Coastal Catastrophic Insurance Band cuts foreign reinsurance companies out of the picture, and can put wind and flood insurance together.
The Hurricane Insurance crisis impacts all Gulf and Atlantic states. In the last century New York had 9 hurricanes; Alabama had 10. 5 of New York’s hurricanes were Cat-3s; 5 Alabama hurricanes were Cat-3. Hurricane direct hits on the mainland U.S. coastline and for individual states 1900-1996 by Saffir/Simpson category. Notes: * - Indicates all hurricanes in this group were moving faster than 30 mph.State totals will not necessarily equal U.S
Based on hurricane tracks during the last 150 years. . . The formation of the Gulf-Coast-East-Coast Grassroots Coalition and the Coastal Band Re-Insurance Strategy unites us and spreads the cost across a base that can pay for losses each year.
This Gulf-Coast-East-Coast/ HHII Coastal Catastrophic Insurance Entity would: -- Be a band 70 miles inland from the beach, running from Maine to Mexico; -- Collect the hurricane premiums currently paid in the coastal band; -- Pay for wind damages that resulted from named storms intheband; -- Encourage and protect privateinsurancecompanies selling non-catastrophic wind insurance and extended homeowners and commercial policies in the band.
Coastal Wind Reinsurance Economics An estimated $8-20 billion in home-owners hurricane insurance premium is collected in this band each year. The bulk of that goes to reinsurers out of the country. Since 2005 it would have collected between $48 to $140 billion in premiums. During that same time reinsurers only paid about $15 billion in hurricane-related claims in the band. $ $48-140 Billion left the country $15 Billion Paid in Claims Had the revenue stream been managed by a domestic Catastrophic Insurance Band, its fund would have $33-$125 billion in reserves today.