Download
1 / 61
610 likes | 799 Vues
Association of Bay Area Governments. Bay Conservation Development Commission. LONG-TERM FORECASTS OF BAY AREA AVIATION DEMAND. Prepared for: Regional Airport Planning Committee. March 27, 2009. Phase 2 Work Scope Objectives.

E N D
Association ofBay Area Governments Bay ConservationDevelopment Commission LONG-TERM FORECASTS OF BAY AREA AVIATION DEMAND Prepared for: Regional Airport Planning Committee March 27, 2009
Phase 2 Work Scope Objectives • Identify and Analyze the Effectiveness of Alternative Strategies for Accommodating the Bay Area’s Long-Term Aviation Demand Without Additional Runways at the Primary Airports • Involve Stakeholders and the Public to Aid in Building a Regional Consensus On How to Respond to Congestion at the Primary Bay Area Airports • Assist RAPC in Developing a Vision and Implementation Plan for the Region’s Aviation System
FTA HMMH Airport Capacity ATC Technologies Project ManagementDemand ForecastsDemand ManagementAlternative Airports Air QualityClimate Change Noise Impacts Airport Systems Consulting Meeting FacilitationBiological Resources Demand Forecasts Demand Management Alternative AirportsHigh Speed Rail Airport Infrastructure Costs BW Research Telephone Survey Technical Study Team & Roles
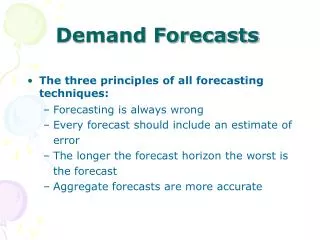
Critical Study Questions • What are the capacity limits of the primary Bay Area airports? • When are these limits likely to be reached? • What strategies offer the greatest potential to allow the region to efficiently accommodate future aviation demand?
Topics • Air Passenger Trends Since the 2000 RASP • Airline Passenger Forecasts • Passenger Forecast Benchmarking • Cargo Forecasts • GA Forecasts • Next Steps
Scope of Baseline Forecast Task • Activity Metrics: • Commercial airline passengers • Cargo volumes • Aircraft operations (including GA) and fleet mix • Planning Years: • 2020 and 2035 • Multiple Scenarios: • Base, High and Low PROJECT OBJECTIVE Update 2000 RASP Forecasts
Development of a Forecast Tracking System is a Key Element of the Study • There is always uncertainty surrounding long-term forecasts of aviation demand. • This uncertainty is accentuated by current economic conditions. • A forecast tracking system will be developed to ensure that the expectations of RAPC and other stakeholders are informed by the latest trends in actual activity. • The tracking system will allow RAPC to adjust the timeline on which the region will reach critical capacity thresholds.
Association ofBay Area Governments Bay ConservationDevelopment Commission AIR PASSENGER TRENDS SINCE THE 2000 RASP
Bay Area Airports Handled 58.6M Passengers Last Year After Peaking at 64M in 2000 Bay Area Passengers by Airport(Enplaned + Deplaned) Average Annual Growth1984-2008 2.6% 1984-2000 4.5% 2000-2008 -1.1% Source: ACI, and individual airport statistics.
Bay Area Airport Passenger Traffic was Showing Stable Growth Through 2000 Bay Area Airport Passengers1984 to 2007 Trend Line (Pre 9/11) 9/11 Attacks and Dot Com Bust Source: ACI, and individual airport statistics.
Since 2000, Bay Area Passenger Demand Has Not Kept Pace with U.S. Air Passenger Demand Percent Change2000-2007U.S. +14.9% Bay Area -5.3% Passenger Index(1990 = 100.0) Note: Region includes SFO, OAK and SJC airports.Source: ACI, Worldwide Air Traffic Report and individual airports.
The Region Suffered Steep Declines in Personal Income During the Dot Com Fallout Real Personal Income Growth Source: U.S. Department of Commerce, Bureau of Economic Analysis
In 2008, Total Bay Area Passenger Traffic Fell by 4% Total Airport Passengers and Percent Change CY 2007 and CY 2008 Total Bay Area Passengers 2007 61.1M 2008 58.6M Change -4.0% +4.5% -21.5% -8.8% Source: Airport data reports.
SFO has Gained a Number of LCC Routes While Top Airlines at OAK have Contracted or Left the Market SFO Low-Cost Carrier Nonstop Service Added Since February 2006 February 2006 to February 2009 Significant Airline Capacity* Changes at OAKApril 2009 vs. April 2008 Southwest -17% Alaska -66% jetBlue -27% American discontinued Continental discontinued Aloha discontinued ATA discontinued Note: JetBlue Boston service is being reinstated in May 2009 * daily scheduled seats Source: OAG Schedules
Association ofBay Area Governments Bay ConservationDevelopment Commission AIRLINE PASSENGER FORECASTS
Domestic O&D Passengers Account for More Than Two-Thirds of Bay Area Airport Passengers 13.6 19.5 10.0 43.1 Sources: Airport Data Reports. U.S. DOT, O&D Passenger Survey. U.S. DOT, T100 Database, Database Products Inc.
Overall Approach to Passenger Demand Forecasts • Analyzed 3 Main Traffic Segments, Each Driven by Different Variables • Domestic O&D, International O&D and Connecting • Domestic O&D • Calibrated Econometric Relationship Between Bay Area Passenger Demand and Explanatory Variables • Personal Income, Airline Yields, and Post 9/11 Structural Change • International O&D • Forecast Bay Area Share of U.S. International Passengers by World Region • Assumed no growth in international traffic for 2007-2011 to account for impact of worldwide economic crisis • Connecting Passengers • Forecast as a Ratio to Domestic and International Passengers
Growth in Bay Area Income, a Primary Determinant of Air Travel Demand, is Forecast to Slow Over the Forecast Period Average Annual Growth in Real Personal Income for the Bay Area Actual and ABAG Forecast Actual Forecast Sources: ABAG, 2007 Projections. Bureau of Economic Analysis and Bureau of Labor Statistics.
Average Annual Change 1990-2000 -2.3% 2000-2007 -2.6% 1990-2007 -2.4% Historically, the Price of Air Travel in the Bay Area Declined, Falling by 2.4% Per Year Between 1990 and 2007 Traffic Weighted Real Average Airline Yield for the Bay Area Actual, 1990-2007 Note: Average Bay Area Yield for Top 50 O&D Markets in CY 2006, weighted by average market share for 1990 and 2006. Sources: US DOT, O&D passenger Survey; Bureau of Labor Statistics, CPI-U.
In the Future, the Price of Air Travel will be Largely Driven by Changes in Oil Prices Actual and Forecast Price of Oil Dollars per Barrel U.S. Energy Information Administration Forecast
Major Forecast Assumptions were Varied to Produce Base, Low and High Forecasts for Bay Area Domestic O&D Passengers [1] Price per barrel in constant 2007 Dollars [2] Impact of Post 9/11 Structural Changes on passenger traffic is -18.3%
Average Annual Growth Historic 1990-2007 1.9% BaseForecast 2007-2035 1.4% In the Base Case, Domestic O&D Passengers are Forecast to Grow by 1.4% per Year Reaching 64M in 2035 Bay Area Domestic O&D Passengers Actual and Forecast Millions Actual Base Case Forecast
Asia and Europe Account for More than Two-Thirds of Bay Area International Passengers Bay Area International Gateway Passengers by World Region 2007 Source: U.S. DOT, T100 Database, Database Products Inc.
Australia and Asia are Forecast to be the Fastest Growing Regions for Bay Area International Traffic Forecast Average Annual Growth in Bay Area International Passengers by World Region Average Annual Growth, 2007-2035BASE CASE
Average Annual Growth Historic 1990-2007 4.5% Base Forecast 2007-2035 3.3% In the Base Case, Bay Area International Passengers are Forecast to Grow by 3.3% per Year Reaching 23M in 2035 Bay Area International Passengers Actual and Forecast Millions Actual Base Case Forecast Note: Includes O&D and connecting passengers.
Total Bay Area Airport Passengers are Forecast at 88M to 129M in 2035 Actual and Forecast Total Bay Area Airport Passengers 2007 and 2035 Average Annual Growth Historic 1990-2007 2.0% Low BaseHighForecast 2007-2035 1.4% 1.9% 2.7% 128.8 101.3 88.2 60.6
Association ofBay Area Governments Bay ConservationDevelopment Commission PASSENGER FORECAST BENCHMARKING
The New 2035 Base Case Forecast of 101M, is 9% Below the Previous Projection of 111M in 2020 Actual and Forecast Total Bay Area Airport Passengers Base Case Update vs. 2000 RASP Forecast Average Annual Growth BaseRASP 2007-2020 1.7% 3.1% 2020-2035 2.0% 2007-2035 1.9% * Base Case passenger number for 2007 is actual. Source: RAPC, Bay Area 2000 Regional Airport System Plan Update 2000, Volume II
The Base Case Forecast is 12.7% Below the Most Recent FAA TAF for the Bay Area Actual and Forecast Total Bay Area Airport Passengers Draft vs. FAA TAF Average Annual Growth BaseFAA TAF 2007-2020 1.7% 1.9% 2020-2035 2.0% 3.0% 2007-2035 1.9% 2.5% * Forecast base year is CY 2007. FAA base year is FYE October 2007. Note: Reported airport traffic is higher than FAA airport statistics.FAA Forecast for 2035 is extrapolated from 2025 using 2024-2025 forecast growth rate.Source: FAA, Terminal Area Forecasts, December 2008
The FAA TAF Forecast Falls Within the Base and High Forecast Range Forecast 2035 Total Bay Area Airport Passengers Draft vs. FAA TAF Average Annual Growth2007-2035 Low BaseFAAHigh 1.4% 1.9% 2.5% 2.7%
Total Cargo Handled by the Bay Area Airports Has Declined Sharply Since 2000 Bay Area Freight & Mail by Airport(Enplaned + Deplaned Metric Tonnes) Average Annual Growth1990-2007 2.4% 1990-2000 7.0% 2000-2007 -3.9% Source: Airports Council International
From 2000 to 2006, Personal Income for the Bay Area Declined Compared to Moderate Growth for the US and CA Average Annual Growth in Real Personal Income 2000 to2006 Air Cargo Demand is Highly Correlated with Economic Growth Source: U.S. Department of Commerce, Bureau of Economic Analysis
As a Result, Bay Area Air Cargo Declined at a Faster Rate than U.S. Air Cargo Average Annual Growth in Air Cargo 2000 to2007 * US based on cargo reported by top 60 US airports, excluding ANC (used for technical stops) and primary integrator sort hubs – MEM/FedEx and SDF/UPS. Sources: ACI, Airport Cargo Statistics Airport Statistical Reports US DOT, T-100 On-flight Database
Cargo Forecast Approach and Assumptions • Assumed No Growth in Cargo Over the Short-term (2007-2011) to Reflect Current Economic Conditions • Developed Long-term Growth Rates for the U.S. Air Cargo Market Based on FAA and Boeing Forecasts • Forecast Bay Area Cargo Growth in Relation to the U.S. Cargo Market • Base Case: Bay Area grows slower than U.S.( 0.75 times based on forecast income growth) • Forecast Bay Area Income Growth of 1.8% p.y. versus U.S. at 2.5% p.y. • Low Case: Bay Area grows even slower than U.S. ( 0.50 times) • High Case: Bay Area grows at same rate as the U.S.
In the Base Case, Bay Area Cargo Tons are Forecast to Grow by 2.4% per Year Reaching 2.7M Tons in 2035 Forecast Bay Area Cargo Tons (in thousands) Note: Enplaned plus deplaned tons. Includes freight and mail for passengers airlines and all-cargo airlines.
Average Annual Growth BellyAll-CargoTotal Base 2.5% 2.3% 2.4% Low 1.7% 1.5% 1.5% High 3.5% 3.1% 3.2% All-Cargo Tons, Which Will Directly Translate into Additional Aircraft Operations, are Forecast to Grow by 2.3% per Year in the Base Case Forecast Bay Area Cargo Tons (in thousands) 3,452 2,740 2,189 1,426 Actual Forecast 2035 Note: Enplaned plus deplaned tons.
After Years of Strong Growth, Business GA has Been Particularly Hard Hit by the Global Recession and Credit Crisis • U.S. Business Jet Operations in 4Q 2008 Fell by Nearly 25% • The Predicted Emergence of Very Light Jets (VLJs) and On-demand Air Taxi has not Materialized • Corporations are selling their corporate planes and cutting back on private business jet travel • Aircraft manufacturers like Bombardier are cutting business jet production • Bombardier expects a 10% reduction in business aircraft deliveries in 2009 • Honeywell expects a 5% to 10% reduction in business aircraft deliveries in 2009
Since 2000, Itinerant GA Operations at the Bay Area Airports have Declined by 9.1% Annually, but Business Jet Activity has Grown Itinerant GA Operations at the Bay Area Airports 2000–2008 Average Annual Growth2000 – 2008 Jet 0.9% Non-Jet -14.0% Total -9.1% Non-Jet Jet Note: Excludes local GA operations 9mainly pilot training and flights that stay in the local airspace) Source: FAA, ETMSC and ATADS Databases
1.05 x U.S. Rate 0.76 x U.S. Rate While Business Jet Activity at the Primary Bay Area Airports has Grown Slower than the U.S. Average, The Bay Area Including Nearby GA Airports Has Been Growing Faster Than the U.S. Business Jet Operations – Historic Average Annual Growth Rate 2000- 2007 Source: FAA, ETMSC and ATADS databases; GA category adjusted to include business jet activity reported in other user group categories.
Bay Area GA Operations are Forecast to Increase at 1.3% per Year During the Forecast Period, with Business Jets Increasing at 2.2% per Year Forecast Annual Rates of Growth (or Decline) in GA Operations by Airport and Aircraft Class 2008- 2035 Note: Bay Area includes primary airports only (OAK, SFO and SJC) Source: SH&E Forecasts (Base Case).
Average Annual Growth Historic 2000-2008 -9.1% BaseForecast 2008-2035 1.3% In the Base Case, Itinerant GA Operations are Forecast to Grow by 1.3% per Year Reaching 185,000 in 2035 Bay Area Itinerant GA Operations Actual and Forecast Actual Base Case Forecast
Average Annual Growth Historic 2000-2008 -9.1% Base HighLowForecast 2008-2035 1.3% 1.7% 0.8% The Forecast Range for Itinerant GA Operations is 162,500 to 204,400 in 2035 Bay Area Itinerant GA Operations Actual and Forecast Millions Actual Forecast
GA Operations Will Remain Concentrated at OAK and SJC Over the Forecast Period Bay Area Itinerant GA Operations by Airport Actual and Forecast Base Case
Next Steps • Distribute Forecast Passenger Demand by Airport • Translate Passenger and Cargo Forecasts into Operations and Aircraft Types for Capacity Modeling • Develop O&D Market Forecasts • Disaggregate Forecast to the Ground O&D Level to Assess Potential Diversion to Alternative Regional Airports and High Speed Rail
Bay Area Passenger Maps March 2009
2008 Bay Area Domestic PassengersOne dot represents 10,000 O&D passengers Primary airport Potential reliever Bay Area city 2008 Domestic Passengers /1 Source: MTC surveys and SH&E analysis; US DOT T100 database. Due to reporting differences, T100 data may not match airport-reportedfigures exactly. Note:1. Includes domestic O&D and connecting passengers