Download

1 / 62
680 likes | 1.11k Vues
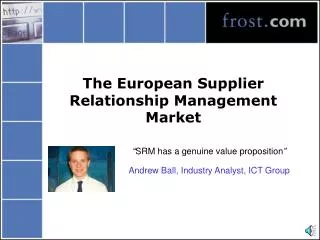
PeopleSoft Supplier Relationship Management Product User Group. Tom Anthony Procurement Product Strategy. Safe Harbor Statement.

E N D
PeopleSoft Supplier Relationship ManagementProduct User Group Tom Anthony Procurement Product Strategy
Safe Harbor Statement The following is intended to outline our general product direction. It is intended for information purposes only, and may not be incorporated into any contract. It is not a commitment to deliver any material, code, or functionality, and should not be relied upon in making purchasing decisions.The development, release, and timing of any features or functionality described for Oracle’s products remains at the sole discretion of Oracle.
Topics for this Morning • Procurement Today • Applications Unlimited • Procurement Looking Forward
Key Supply Chain Collaboration Trends, 1987 - 2007 2007 • COGS Analysis • COGS approx. 55% of Revenues (Same) • COGS primarily purchased materials & services costs • US share of global mfg output, 2005: 22.4% (Constant) • China share of global mfg output, 2005: 8.0% (Doubled) • China’s global mkt share – IT H/W Exports, 2004: #1 • China’s global mkt share – Comms Equipment Exports, 2004: #1 • Order Cycle Time Trends • Approx. order cycle time (order to delivery): 2-4 weeks • Transportation & logistics managed with TMS, strong analytics • Consumers’ / Customers’ marketplace • Best Practices Analysis – Mfg Cos. • eProcurement: At least 40% of cos. • Online Reverse Auctions: At least 15% of cos. • Strategic Sourcing: At least 60% of cos. • Supplier Relationship Management: At least 35% of cos. • Supplier Performance Scorecarding: At least 30% of cos. • Chief Procurement Officer: At least 40% of cos. • Chief Supply Chain Officer: At least 50% of cos. 1987 • COGS Analysis • COGS approx. 55% of Revenues • COGS primarily raw materials costs • US share of global mfg output, 1995: 22.3% • China share of global mfg output, 1995: 4.2% • China’s global mkt share – IT H/W Exports, 2000: #13 • China’s global mkt share – Comms Equipment Exports, 2000: #5 • Order Cycle Time Trends • Approx. order cycle time (order to delivery): 8-12 weeks • Transportation & logistics managed manually, little/no analytics • Manufacturers’ marketplace • Best Practices Analysis – Mfg Cos. • eProcurement: At most 2% of cos. • Online Reverse Auctions: Non-existent • Strategic Sourcing: At most 5% of cos. • Supplier Relationship Management: At most 3% of cos. • Supplier Performance Scorecarding: At most 2% of cos. • Chief Procurement Officer: At most 2% of cos. • Chief Supply Chain Officer: At most 3% of cos. More production & costs outsourced, globally; compression of order cycle times by 3-4X; and dramatic rise in SC best practices adoption Supplier Collaboration is Critical for Success Sources: US-China Business Council; Stephen Roach/Morgan Stanley; OECD; Ben Hackett/Global Insight; William Ward/Clemson University; Wei Li/Darden/University of Virginia; SBA and Innovation & Information Consultants; McKinsey; AT Kearney; Datamonitor; Aberdeen; Forrester; and Oracle Global Insight Research and Analysis
Items that scored an average of 3 and over – very significant Items that scored an average of 4 and over – highly significant Cross-Sector Analysis Suggests that Procurement Activities Are Top Priority to Companies PLANNED 2007 ACTIVITIES BY SECTOR TOTAL AVERAGE CPG EUC FS MTR PUBLIC Procurement Outsourcing – Commodities 2.4 1.5 1.6 4.0 2.7 2.2 Improvement in Spend Information and Availability 4.0 3.5 3.1 4.3 4.2 4.2 Compliance to Contracts Within the Business 4.1 3.5 3.8 3.8 4.4 4.3 e-Procurement – new implementation/optimization 3.3 3.5 2.8 3.3 3.0 4.0 Emerging Markets Sourcing 3.0 3.0 2.6 2.8 4.0 2.2 Contract Management 3.8 4.0 2.6 4.0 4.0 4.0 eAuctions and eRFQ 3.2 2.5 2.6 2.8 3.0 4.2 Activities to Secure Legislative Compliance (e.g., SoX) 2.7 3.0 2.3 2.8 2.5 2.9 Category Management Introduction/Extension 3.5 1.5 3.3 4.0 4.0 3.3 Supplier Management Improvements 3.9 2.5 3.5 3.5 4.1 4.2 Purchase to Pay Improvement 3.8 3.5 3.5 3.7 4.2 3.7 Purchase to Pay Outsourcing 1.8 1.5 1.6 2.8 2.0 1.2 Sourcing Process Improvements/Standardization 3.9 3.0 4.2 3.8 4.0 3.8 Lean Supply/TQM/6 Sigma Initiatives in Procurement 2.1 1.5 2.2 2.4 2.9 1.3 AVERAGES BY SECTOR 3.2 2.7 2.8 3.4 3.5 3.3 Source: Capgemini Consulting Research Report, “Strategies and Insights for Today’s CPO – SRM Research 2006-2007: Business Insights,” Editors Gert van Bokhorst et al., published in September 2006 by Capgemini Nederland B.V. This Figure 2 is on p. 5. Legend: CPG = Consumer Packaged Goods; EUC = Energy, Utilities and Chemicals; FS = Financial Services (including Insurance); MTR = Manufacturing, Transportation & Retail; and Public = Government and Public Sector.
Survey Legend 5.0 – Critical focus area 0.0 – No focus area Procurement Activities and Improvements Are Top Priority for Chief Procurement Officers Chief Procurement Officer Agenda 2007 CPO Cross-Industry Survey Ranking #1 #2 #3 #4 #5 #6 #7 Source: Capgemini Consulting Research Report, “Strategies and Insights for Today’s CPO – SRM Research 2006-2007: Business Insights,” Editors Gert van Bokhorst et al., published in September 2006 by Capgemini Nederland B.V. This Figure 1 is on p. 4.
Closed-Loop Sourcing, Procurement & Analytics Delivering real sourcing/procurement/analytics savings Project Management Procurement Intelligence & Analytics Analyze needs & market dynamics Manage supplier performance Complete requisition Approve requisition Strategic Sourcing Cycle Procurement Order Cycle Contract finalization & implementation Select goods or services Develop sourcing strategy Place purchase order Contract Management Invoice verification, match & payment Request for quotation/ proposal Goods or services receipt Negotiate Identified Savings (In The Sky) Negotiated Savings (On The Table) Realized Savings (In The Pocket) Source: Capgemini Consulting Research Report, “Supplier Relationship Management Solutions: Expected Value – SRM Research 2006-2007: Solutions Analyses,” Editors Gert van Bokhorst et al., published in September 2006 by Capgemini Nederland B.V. This Figure is on pp. 5, 17 and 21.
Benefits of Achieving World-Class Supplier Collaboration and Procurement Performance Indicator TypicalProcurementOrganization World-Class ProcurementOrganization Comparison Summary Cost per Purchase Order 57% Less per PO US $19.98 US $8.54 FTE per US$1 Billion of Spend 49% LessStaff 89 45 Total Cost of Procurement(as % of Spend) 27% LowerCosts 1.01% 0.74% 46% Less – More Buying Power Suppliers per US$1 Billionof Spend 7,710 4,171 Number of PO’s ProcessedAnnually per Procurement FTE 3.6x More Productive 611 PO’s 2,214 PO’s Amount Spent on Technology per US$1 Billion of Spend US $1.1 million US $1.4 million 27% More Sources: Hackett – 2005-2007; APQC Research – 2006; and Oracle Customer Experience/Results
Benefits of Achieving World-Class Supplier Collaboration and Procurement Performance Indicator TypicalProcurementOrganization World-Class ProcurementOrganization Comparison Summary Utilized Formal Strategic Sourcing Process and Program on __% of Total Global Spend 29% 43% 14% Better __% of This Industry’s Companies Surveyed are Considered SRM Leaders Banking & Insurance: 5% Media & Entertainment: 50% 45% Better Average Percent of Suppliers Compliant with Contracted Price and Discounts 73% 91% 18% Better % Reduction in Material/Service Purchased Costs from Having Contract Mgmt Automation Integrated with ERP 2% to 7% Lower N/A N/A Average % Time Spent on Risk Mgmt & Decision Support/Analytics Activities, per Procurement Professional 15% to 25% Better 20% 35%-45% Reduction in Maverick Spend, Year-over-Year Comparison N/A 36% Lower N/A Sources: Aberdeen Group – 2005-2007; Accenture, INSEAD and Stanford University – 2005/2006; and Oracle Customer Experience/Results
Supplier Collaboration and Procurement Improvements Can Help Create Dramatic Cost-Reduction Results Improvement Area Typical Value Created Typical benefits achieved (as % of price/cost reduction) Total Cost Management Demand Management Supply Base Management • Lifecycle cost/total cost of ownership • Transaction costs (requisition, PO, approve, resolve dispute, pay, etc.) • Inventory carrying costs • Payment terms management • Tax/customs optimization • Standardized items • Reduced contract “leakage” • Visibility of contracts • Policy compliance and measurement • Item substitution • Requirements and specifications management • Volume leverage/redistribution • Bid-based renegotiation • Price/performance benchmarking • Enhanced and timely competition • Strategic sourcing – consolidation with preferred suppliers 3-5% 4-10% 4-10% Source: Capgemini Consulting Research Report, “Supplier Relationship Management Solutions: Expected Value – SRM Research 2006-2007: Solution Analyses,” Editors Gert van Bokhorst et al., published in September 2006 by Capgemini Nederland B.V. This Table is on p. 6.
Procurement Value Contributors • Strategically source more goods and services • Improve supplier leverage to reduce costs • Increase category coverage • Realize negotiated savings by enforcing contracted pricing and terms • Leverage self-service to reduce operational costs and drive behavior • Increase and improve value-added activities
Shift Towards Center-led Procurement Source: Procurement Strategy Council Research, 2007.
Center-led Procurement Defined Source: Procurement Strategy Council Research, 2007.
Value of Procurement Shared Service Centers 61% of all companies have a shared services center; of those, just over half have a center-led procurement shared service center Global Global • Key Benefits • Lower direct spend incremental 2-6% and indirect spend incremental 2-9% • Standardize and optimize critical procurement processes • Improve controls, risk mgmt, visibility & performance • Improve internal service levels • Enhance collaboration internally as well as externally • Shift procurement mindset from cost leader to value generator Local Employee Global Process Owner • Issue and maintain policies and procedures • Enter purchase requisition • Receive goods online • Approve local requisitions • Submit expense claim online Shared Services Center Local Finance • Select and negotiate with suppliers • Maintain master data • Distribute P.O.s • Receive, process invoices • Audit expense reports • Review and sign purchase contracts • Submit maintenance requests for supplier database • Scan physical invoices Sources: Accenture; AT Kearney; AvantGard; Center for Advanced Purchasing Studies; Deloitte Consulting; Hackett; JP Morgan; Oracle Corporation; 170 Systems; and Oracle Global insight Research and Analysis.
eSupplier Connection Value • Leverage Self-Service for Suppliers • Automate the Procure-to-Pay process across a broad range of suppliers • Lower costs and improve service through structured communication • Reduce costly errors inherent in paper-based processes • Reduce routine supplier inquiries • Improve supplier relationships as well as internal sourcing, procurement execution, and productivity Real-time access Suppliers
eSupplier Connection Oracle Differentiator CHALLENGES CAPABILITIES VALUE • Manually intensive paper-based procure-to-pay processes • Information lag results in lack of business agility • Costly administration of supplier content • XML and EDI integration not broadly applicable • Purchasing resources engaged in non-value-add administrative tasks • Inaccurate picture of supplier profile for regulatory reporting • Single integrated solution for direct, indirect and services purchasing • Internet based self-service procure-to-pay solution • Real-time access to transactions, status and performance information • Self-administered supplier profile • Supplier self-service content management • Reduced requisition-to-pay process and administrative costs • Enhanced supplier communications, relations and collaboration • Improved operational productivity • Enhanced supply base operational performance • Information for more timely, accurate, profit-focused decision making • Reduced manual efforts • Ensure that suppliers are paid accurately
“Strategic sourcing is emerging as the leading strategy to control costs, capture innovation, and maximize performance.” Sourcing At-A-Glance Buying Professional Identify Suppliers & Opportunities Define Strategies & Negotiations Conduct On-Line Negotiations Analyze & Award Approve & Issue LOB Stakeholder Supply Base
“E-sourcing technologies deliver information visibility and globally infrastructure to enhance and accelerate strategic sourcing.” Sourcing Value
Sourcing Oracle Differentiator CHALLENGES CAPABILITIES VALUE • Sustainable generation of year-over-year savings • Ability to collaborate and demonstrate value to lines of business • Enforce sourcing policies and influence business goals • Category expertise required for repeatable, optimized business processes • Time-consuming quote-to-contract cycles • Integrated sourcing, contracting, and execution platform • Advanced sourcing with optimized award selection and full supplier enablement • Collaborative sourcing approach enables key stakeholder involvement • Best practice support of including contract terms in the negotiation • Single integrated solution for direct, indirect and services sourcing • When integrated with rest of purchasing and ERP, optimized sourcing typically delivers 1.5-15% cost savings on direct and indirect spend • Reduce sourcing negotiation costs and cycle times • Improved ability to deliver repeatable, optimized business processes • Enhance communications, relations and collaboration both internally and with suppliers
Central Contract Repository Supplier Contract Management Value Buyers • Terms and Conditions • Revisions • Signatures • Transactions • Accounting • Scanned Images • Specifications • Drawings • Supplier performance • Related contract documents • Spend analysis • Supplier performance Contract Administration • Compliance status • Budget performance Legal • Risk assessment • Regulatory changes • Provide global, secure access across the enterprise • Enforce corporate governance via enhanced contract visibility & control • Increased Contract Utilization • Convert Negotiated Savings into Realized Savings Suppliers • Contract commitments • Pricing Finance • Current and future liability • Compliance status of new reg.
Contract Management OpportunityRapid Payback, Significant ROI – Especially When Integrated With ERP • Contract Spend (vs. off-Contract) 7% • Contract Creation & Admin Costs 10-30% • Contract Negotiation Cycle Time 50% • Volume of Erroneous Payments 75-90% • Compliance with Regulatory Guidelines 90-100% Source: Aberdeen; Goldman Sachs, Global Equity Research “The old filing cabinet approach - the paper-based approach - simply doesn't scale to the volume, complexity and relevance of today’s business contracts. It's really time for enterprises to get control of their contracts so that they become genuine assets that are produced in a consistent and auditable way.” - Andy Kyte, Analyst, Webcast, June 2005
Supplier Contract Management Oracle Differentiator CHALLENGES CAPABILITIES VALUE • Inability to enforce contracted pricing, terms, and deliverables • Lack of contract visibility and exposure analysis tools • Lack of contracting best practices and standards • Inability to convert negotiated to realized savings • Inability to measure and impact contract leakage • Increased compliance pressures • Central integrated contract repository • Centralized terms library and comprehensive contracting policies • Rapid integration of MS Word redline edits into contracts • Flexible workflow approval rules • Deliverable tracking monitors supplier performance • Enforce negotiated pricing, terms, and deliverables (with consistent year-over-year cost savings of approx. 2-8%) • Ensure consistent contracting standards across the organization • Improved corporate compliance using contracts standards and deviations as well as approval rules • Streamline internal collaboration and supplier negotiation of both commercial and legal terms
Services Procurement Value Define Progress Payment Schedule for Complex Services • Improve management of complex services spend • Match supplier provided timecards, receipts, and work confirmation information against agreements and invoices • Manage recoupment and releases of advances and retainage
Leading Organizations Are Extending Materials Procure-ment Processes to Optimize Services Procurement • Hard-dollar cost decreases • Better sourcing of suppliers • Increased contract compliance • Soft-dollar shrink • Reduction in number of suppliers • Improved controls and visibility Potential Savings From Improved Services Procurement Source: Booz Allen Hamilton, “How to Capture Hidden Value” 1 Note: Savings estimates are first-wave reductions
Services Procurement Oracle Differentiator CHALLENGES CAPABILITIES VALUE • Non-integrated and often paper-intensive processes • Inefficient processes result in lost early pay discounts • Low invoice accuracy and manual reconciliation processes • Limited visibility into services spend and supplier performance • Lack of corporate standard or competitive pricing for services • Lack of preferred supplier usage • Integrated end-to-end services management solution • Corporate standard rates and contract enforcement • Auto-matched and self-billed invoices • Rules-based approval framework for ensuring the right oversight • Actual customer first-year svcs procure cost savings that we have seen: 3-23%; year-over-year svcs procure cost savings: 1-5% • Improve productivity and reduce lost discounts by automating manual processes • Improve price/contract compliance with service providers • Increase supplier leverage by enforcing use of preferred suppliers • Improve visibility into services spend and supplier performance
“Procurement masters are different. They approach the function more strategically and holistically. They engage more fully with suppliers and frequently work to partner rather than bargain. Perhaps most importantly, procurement masters are technology leaders: They use processing power to increase efficiency; make better and faster decisions; leverage and focus internal skills; and connect with suppliers and third parties.” Accenture, October 2007 How to Create and Sustain Procurement/SRM/Spend Analytics Mastery in Today’s Marketplace • People must be continuously trained, challenged, rewarded and refreshed • Processes must be at or upgraded to best-in-class People Process Mastery Technologyand Data • Technology (esp. analytics) and accurate data serve as the glue to keep your people, processes, profitability and competitive edge world-class and differentiated Sources: Accenture, “High Performance Through Procurement: Accenture Research and Insights into Procurement Performance Mastery,” October 2007, Survey of 225 Companies; and Tim Chapman, Jack Dempsey, Glenn Ramsdell and Mike Reopel, “Purchasing: No Time For Lone Rangers,” McKinsey Quarterly 1997 Number 2.
Achieving Benefits – Lessons Learned • Develop a Target Baseline Cost Savings Goal • Provide Guidelines for Recording and Reporting Savings • Develop Sourcing Strategies • Execute Sourcing Strategies • Collect and Assimilate Savings Information • Review Savings Submissions and Calculate the Actual Realized Benefits • Ensure That Savings Have Sign-Off’s • Report and Monitor – Track Savings and Spend Against Business Case and Targets, Communicate Reports and Supplier Scorecards Against Results, Report and Track Maverick Spend and Actual Spend Volumes by Supplier, by Product, by Business Unit, etc. Source: Oracle Consulting
Lessons Learned – How to Best Implement Business Process Improvements (BPI) and Enterprise Applications • Strong executive sponsor • Strong, competent project director/manager • Re-evaluate and optimize your business strategy and business processes • Staff your project with your best people • Control/focus your project scope: Get 80% of what you need implemented in months, rather than 100% in years or never • Minimize customizations Sources: Oracle Consulting and Oracle Global Insight experience; ERP implementation and lessons-learned white papers and articles written by R. Michael Donovan, Gary S. Vasilash, Robert S. Putrus, Manufacturing Management Ltd. (MML), Project Management Institute (PMI) and Project Perfect; Matthew Symonds and Larry Ellison, Softwar: An Intimate Portrait of Larry Ellison and Oracle, Simone & Schuster, NY, NY: 2003.
Oracle’s Applications Strategy Talk, Listen, and Work with Customers and Partners • 400+ User Groups • Product Development Committee • Customer Advisory Boards • Product Strategy Councils • Industry Strategy Councils • Fusion Strategy Council • Services Strategy Council • Partner Councils • Executive Roadshows • Customer Focus Groups and Surveys • End User Groups (PUG) • One on One meetings with Customers
Oracle’s plan to continue providing ongoing enhancements to current PeopleSoft Enterprise applications beyond the delivery of Oracle Fusion Applications Oracle’s Applications StrategyApplications Unlimited For PeopleSoft Enterprise Latest Release Next Release Version 9.0 Version 9.1 Unlimited Unlimited FUSION
Serving PeopleSoft CustomersDedicated PeopleSoft Development Team Management Team Has 115+ Years of PeopleSoft Experience!
Applications Unlimited ContinuesServing PeopleSoft Customers By Delivering… COMMITMENT To PeopleSoft Applications • More Choice, Value, Visibility, and Time • Dedicated Development Team • Delivering By Working Smarter VALUE From The Most Current Release • Extended Value Using Next Generation Technology • Best-in-Class Business Processes • A Superior Ownership Experience OPPORTUNITIES Now And In The Future • Upgrade to the Current Release • Continued Product Releases • Future Upgrade Option to Oracle Fusion Applications
Oracle’s Applications StrategyApplications Unlimited Delivers More… • More Value • Dedicated Development Teams • Continued Product Releases • More Choice • Upgrade To New Releases • Deploy Additional Modules • Remain On Existing Applications • Adopt Next-Generation Technology • More Visibility • Customer-Driven Product Roadmaps • More Time • No Forced Upgrades • Oracle Lifetime Support
Delivering On Applications Unlimited Working Smarter… PeopleSoft “Development Kernel” Remains Focused • New Development – Pleasanton, CA Offices • Sustaining Development – India Development Center Leverage Centralization and Shared Services • Program Management Office • Environments / Demo Systems • Global Support • Industry Strategy and Global Strategy Teams • Product Marketing • Collaboration Across The Organization • Collaboration Between PeopleTools, Oracle Server Tech, and Database Teams • Leveraging Knowledge from All Application Product Families • Standardization of Best Practices and Policies
PeopleSoft 9.0The Extended Value Release PeopleSoft 9.0 Enables… Extended Value Through Technology Best-in-Class Business Processes A Superior Ownership Experience Release 9.0 Themes
PeopleSoft 9.0Challenges/Capabilities/Value PeopleSoft Differentiator CHALLENGES CAPABILITIES VALUE • Web Services Infrastructure • Oracle Fusion Middleware BPEL Process Manager • Oracle XML Publisher • Sustainable Compliance • Integrated, Enterprise-Wide Talent Management • BPEL Key Cross-Application Processes for Financial Services & Communications Industries • Campus Solutions Warehouse for Higher Education Customers • Increased Usability and Streamlined Processes • Application Management Tools • Extend Value Using Next Generation Technology • Deliver Best-in-Class Business Processes • Drive a Superior Ownership Experience • Heterogeneous IT Environment • Complex and Changing Reporting Requirements • Multiple Data Sources and Data Warehouses in Addition to EPM • Comply with Legal and Regulatory Requirements • Attract, Recruit, and Retain Skilled Resources • Address Industry Specific Requirements • Accelerate User Adoption • Improve Efficiency and Productivity • Reduce Operating Costs
Extend Value UsingNext Generation TechnologyIntegrating Key Fusion Capabilities into Release 9.0 Web Services Share PeopleSoft release 9.0 functionality with other applications Business Flow Orchestration Define and coordinate cross-application business processes Oracle Customer Data Hub Integration Consolidate, enhance, and share master customer data XML Publisher Enable business users to create documents leveraging XML data
Supplier Relationship ManagementInsight-Driven Business Processes Business Insight SRM Dashboard • Expanded KPIs for buyers and managers • Summary metrics at business unit level • Supplier performance analytics pagelet Business Processes Contract Management Services Procurement Requisitioning • Request to suppliers for contract creation • SLA compliance tracking and non-compliance alerts • New time reporting functions & flexibility • Expanded service coordinator capabilities • Amount-only requisitions • Off-catalog request enhancements
Databases Middleware Applications PeopleToolsA Solid Foundation to Build From • Integration with Enterprise Manager • Enables IT administrators to graphically monitor and manage R9.0 systems from the same, single console as other Oracle databases, middleware, and applications • Improved SOA Support • New graphical UI and increased standards supportto simplify the creation / modification of Web Services for R9.0 applications • Stronger integration of Web Services with BPEL Process Manager • Enhanced Patching & Maintenance • Streamlined patching through tools that improve understanding of your environment and impact of patches • Simplified carry-forward of existing customizations Available with Upgrade to R9.0 or PeopleTools-Only Upgrade to 8.48
The Current ReleaseWhy Upgrade To PeopleSoft 9.0? Benefits of Enhancements • Gain Business Value of All Releases Through 9.0 • Use of Next Generation Technology • Best-in-Class Business Processes • Superior Ownership Experience Planning Options • Separate PeopleTools and Applications Upgrades • Future Upgrade Process to Oracle Fusion Applications • Available Services & Tools • Upgrade Aids in PeopleTools • Oracle’s Solution Center Upgrade Lab • Oracle Consulting’s Upgrade Services
The Upgrade ExperienceUpgrade Complexity Drivers Driver • Customizations • Are customization replaced by new functionality? • What data elements are customizations effecting? • Integrations • Do all existing point-to-point integrations need to be rebuilt? • How can new integrations be quickly built? • Maintenance Updating • What preparation is needed before starting an upgrade? • Does the system have the correct patches and updates applied? • Process & Resources • What resources are available to assist before, during, and after an upgrade? • What is the best methodology for an upgrade?
Change AssistantAutomating The Upgrade Process Upgrade Template Change Package Patches & Updates Change Assistant • Change Assistant • Template driven • Validates pre-requisites • Applies patches and updates • Logs of updates applied • Packages customizations • Complete list of upgrade steps • Define upgrade type (e.g. initial, test, final) Customizations
Change Impact Analyzer (CIA)Understanding Customizations, The Key To Upgrading Application Designer Development, Test Import / Export Project Change Package CIA Workspace Change Impact Analyzer Analysis List Production, Test Java App Rules 8.2x & 8.4x Rule Engine Provide better assessment of the changes to be introduced and accurate guidance on where and what to test
Visual Compare/MergeStreamline Customizations, Reduce Upgrade Impact Navigate To Next/Previous Delta Click To Merge/Unmerge Source Object: A Source Object: B • Supported Objects: • COBOL files • Configuration files • Data Mover scripts • Initialization files • SQR source files • SQL files • SQR report files Merged Output
The Current ReleaseRelease 9.0 Traction Customer Count Over Time Early Success Program Customers Release 9.0 customer activity as of January 2008 > 2,500 Downloads of Release 9.0
Continued Product ReleasesPeopleSoft 9.1 Themes PeopleSoft 9.1 Plans To Enable… Intelligent Business Execution Organizational Effectiveness Flexibility Release 9.1 Themes