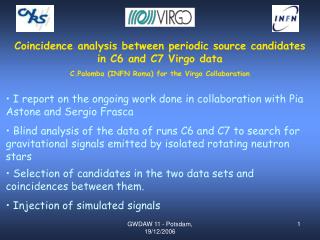
VIRGO-bars joint data analysis
VIRGO-bars joint data analysis. Francesco Salemi for the VIRGO-bars Collaboration. Summary. INTRO Target Signals Sensitivity Curves Exchanged data MDC injections Time errors 2-fold Coincidence Analysis Optimization of the thresholds Background & Efficiency Statistical Analysis


VIRGO-bars joint data analysis
E N D
Presentation Transcript
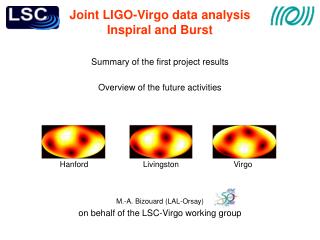
VIRGO-bars joint data analysis Francesco Salemi for the VIRGO-bars Collaboration Francesco Salemi - London, October 26th - 27th, 2006
Summary • INTRO • Target Signals • Sensitivity Curves • Exchanged data • MDC injections • Time errors • 2-fold Coincidence Analysis • Optimization of the thresholds • Background & Efficiency • Statistical Analysis • Preliminary Results • TODO • 3-fold Coincidence Analysis Francesco Salemi - London, October 26th - 27th, 2006
Outline • VIRGO-bars Network:AURIGA, EXPLORER, NAUTILUS and VIRGO • Goal: assess interpreted confidence intervals on the flux of gravitational waves (damped sinusoids, DS) coming from the galactic center (GC). • The interpretation comes from software injections (MDC) which are used to compute the efficiency of detection for a source population • Main methodology: coincidence search on trigger lists provided by each detector. The coincident counts, divided by the efficiency and by the observation time, become observed rates (or upper limits on rates). • Optimization of thresholds: for each template and each given target amplitude, the best compromise between efficiency and FAR is searched, using variable threshold for each detector with ½ hour bins. • The efficiency acts not just passively at the end of the analysis to calibrate the results, but also actively during an optimization phase. • Blind analysis: in order not to bias results by feedbacks on methods from looking at results, a “secret” time offset has been added to detector times. Francesco Salemi - London, October 26th - 27th, 2006
The VIRGO-bars network • 24 hours of data taking during C7, starting from UTC time 810774700, • (14 Sep 2005 - 23:11 27s) • Heterogeneous Network: • spectral sensitivity • directional response Francesco Salemi - London, October 26th - 27th, 2006
Software injections details • Damped Sinusoids: elliptic polarization distributed signals as it is expected for binary systems at GC • Several damping times and central frequency to span our parameter space. • 11 templates • For each class, we generated randomly: • injection times polarization angle inclination angle • N=8640 (1/10 s) • hrss=1e-20 - 2e-18 • Hz-1/2 Francesco Salemi - London, October 26th - 27th, 2006
Single detector ETG and Observables • AURIGA: WaveBursts (S. Klimenko et al, LIGO-T050222-00-Z) was succesfully adapted to AURIGA data. The cluster S/N (close to the optimal) was used as an indicator of the signal magnitude. • NAUTILUS and EXPLORER: a single linear Wiener-Kolmogorov filter matched to the impulse response is applied to the output data. The impulseS/N was used as an indicator of the signal magnitude. • VIRGO: PowerFilter is the chosen trigger generator. The logarithmic S/N was used as an indicator of the signal magnitude. Francesco Salemi - London, October 26th - 27th, 2006
Exchanged Data (correlograms) Francesco Salemi - London, October 26th - 27th, 2006
Exchanged data: triggers+MDC @ 1e-19 Hz-1/2 AURIGA N=1413 EXPLORER N=5614 VIRGO N=24241 NAUTILUS N=8628 Francesco Salemi - London, October 26th - 27th, 2006
Efficiency DS: f0=930 Hz tau=30ms • Single detector efficiencies • For VIRGO, ~ 7 hrs out of 24 have been excluded by epoch vetoes • => Asymptotic 70% DS: f0=866 Hz tau=10ms DS: f0=914 Hz tau=1ms Francesco Salemi - London, October 26th - 27th, 2006
Time coincidence • Our ETGs are not “matched” to DS • Time errors are dominated by systematic biases. • The narrower the bandwidth, the greater the signal is distorted • Example : AURIGA – VIRGO coincidences. The double peak is due to the multimodal time error by PF • The coincidence “window”, Tw = 40 ms f0=914 Hz tau=1ms f0=866 Hz tau=10ms f0=930 Hz tau=30ms Francesco Salemi - London, October 26th - 27th, 2006
Optimization (1) • To shrink the interpreted confidence interval we choose to optimize the 2-fold coincidence serches => Better Upper Limits • For each configuration/template/amplitude, the magnitude thresholds for the 2 detectors are tuned => large trial factor • The criterion is to maximize the ratio efficiency over the fluctuation of the accidental coincidences. • The efficiency is calculated on the data sets containing the MDC injections • The average background of accidental coincidence is estimated by means of +/- 400 time shifts (~ +/- 7 min). Poisson point process: fluctuation is sqrt(counts). • The magnitude thresholds are optimized every 30 min Francesco Salemi - London, October 26th - 27th, 2006
Optimization (2): DS @ 914 Hz, 1ms, 1e-19 Hz-1/2 AURIGA VIRGO Francesco Salemi - London, October 26th - 27th, 2006
Statistical Analysis (1) • Blind Analysis: we don’t “open the box” of the zero-lag until we have fixed all the tunable parameters and chosen the methodology to be used. • Large trial factor => multiple tests performed, increase of the false claim probability • to reduce the trial factor, for each template/amplitude, we analyze only on the best couples of detectors (72). • The effective global probability is empirically estimated over the 400 time shifted data sets => the single trial confidence is tuned in order to reach a total false claim of 99% Global confidence Single trial confidence Francesco Salemi - London, October 26th - 27th, 2006
Statistical Analysis (2) • The confidence intervals were set according to the confidence belt already used by IGEC1 (see L. Baggio and G.A. Prodi, “Setting confidence intervals incoincidence search analysis" in Statistical problems in particle physics, astrophysics and cosmology, R.Mount, L.Lyonsand and R.Reitmeyer editors, Stanford (2003) 238) • When the null hypothesis test is fulfilled, than the confidence interval is simply an Upper Limit • Notice that: a rejection of the null is a claim for an excess correlation in the observatory at the true time, not taken into account in the measured noise background at different time lags. Whether these correlations are true GW or just correlated noise signals is not known. • A Virgo-note was produced to discuss the methodology: • VIR-NOT-FIR-1390-328 Last Friday we exchanged the secret time offsets and we “opened the box” and… Francesco Salemi - London, October 26th - 27th, 2006
Results for the 2-fold coincidence searches Upper Limits at 95% coverage Preliminary No excess of Coincidences was found. The null hypothesis survives... Francesco Salemi - London, October 26th - 27th, 2006
Next Steps • The 2-fold coincidence searches have a high level of accidental background, single detection not possible=> 3-fold coincidence searches • Goal: to be able to issue a claim at 99.5% confidence on a single observed triple coincidence. • In the next weeks, we plan to try the 3-fold coincidence search. The methodology and all the key parameters have been decided before “opening the box” of the double coincidence searches. • Optimization of thresholds: for each template and some MDC amplitudes (i.e. 1e-18, 5e-19 and 1e-19 Hz-1/2. ), the best compromise between efficiency and FAR is searched, using variable threshold for each detector with ½ hour bins in order to reach the target level of background. • The zero-delay will be analysed with the optimization for the minimal signal amplitude which allows at least a level of efficiency of 40%. Configurations of detectors/template, which do not reach such minimal level for any of the chosen amplitudes, will be discarded. • Given the chosen 99.5% of confidence level, to be compared with the 99% (~1% spread) for the 2-fold coincidence searches, performing the 3-fold coincidence searches will slightly affect the global confidence. Francesco Salemi - London, October 26th - 27th, 2006
EXTRA SLIDES Francesco Salemi - London, October 26th - 27th, 2006
optimal alignment Software injections details (1) We chose a family of DS with several damping times and central frequency combination in order to span evenly our parameter space. For all the classes, we set hrss = 10−23Hz −1/2 (this can be changed simply rescaling all the signals). • For each class, we generated a series of injection times (signal arrival at the center of the Earth), spaced by 10s + uniform random jitter of +/- 0.5s. • For each class and for each injection time we generated a random polarization angle in [0, 2], and a random inclination angle such that cos is distributed uniformly in [−1,1]; Francesco Salemi - London, October 26th - 27th, 2006
Astrophysical motivations: The chosen signals can be produced by: BH-BH ring-down. In this case the energy release to make a detection realistic should be about 10-3 - 10-4 Mo for a galactic event. Andersson N. and Kokkotas K., Mon. Not. Roy. Astron. Soc.299 (1998) Kokkotas K.D. and Schmidt B.G., http://www.livingreviews.org/lrr-1999-2 (1999) f-mode of neutron stars. Here too the energy release must be high. Moreover, the f-mode could produce a wave with variable frequency and damping time, which anyway should sweep inside the observed frequency band. Ferrari V. et al., Mon. Not. Roy. Astron. Soc.342 (2003) 629 The wave polarisation should be linear for SN explosions, but elliptic for BHBH coalescenses (V. Ferrari, private communication). Francesco Salemi - London, October 26th - 27th, 2006
For each outcome x one should be able to determine a confidence interval Ix For each possible m, the measures which lead to a confidence interval consistent with the true value have probability C(m), i.e. 1-C(m) is thefalse dismissal probability Confidence Belt & Coverage physical unknown confidence interval coverage experimental data Francesco Salemi - London, October 26th - 27th, 2006