Download
1 / 37
370 likes | 559 Vues
Analysis of noise in VIRGO. What we mean for “noise analysis” How is the noise analysis work organized in Virgo Which tools Noise and data analysis groups What has been done Some results in noise identification Sensitivity curve debugging (noise understanding).

E N D
What we mean for “noise analysis” • How is the noise analysis work organized in Virgo • Which tools • Noise and data analysis groups • What has been done • Some results in noise identification • Sensitivity curve debugging (noise understanding)
What we mean for noise analysis • VIRGO commissioning: • interferometer still in a development phase • the Interferometer’s configuration is progressively upgraded • The sensitivity is measured through the output signal calibration • We try to identify the different sources of the noises • We try to upgrade things in order to reduce the identified noise source
Work organization • Engineering runs: allow collection of data (3-5 days every 2 months) • Data Analysis: division in investigation groups (normally 3-4 persons with a coordinator) • Discussion of the results in data analysis meetings • Depending on the results, the further activity is decided (implementations, modifications, etc.)
Summary of the performed activity • CITF (2000-2002): • Five engineering runs (E0-E4) • About 5-10 investigation groups • About two meetings after each run • VIRGO (2003-now): • Four Virgo runs up to now (the last at the end of June) • About 10 investigation groups • Normally one preliminary meeting short after the run, then a more detailed one http://wwwcascina.virgo.infn.it/commissioning/Eruns.html
Engineering runs • 4 VIRGO Engineering runs (C1-C4, now five days each) • C1 (14-17 November 2003): North Arm locked • C2 (20-23 February 2004) : North Arm locked+linear alignment; West Arm locked • C3 (23-27 April 2004) : North Arm locked+linear alignment+second stage frequency stabilization; Recombined locked (lock acquisition mode, no linear alignment) • C4 (24-29 June 2004): Recombined+linear alignment on both arms+second stage frequency stabilization
Investigation groups • Individuated investigation groups: (http://wwwcascina.virgo.infn.it/DataAnalysis/Noise/) • Present list of the groups: • Calibration • Locking performances and noise • Alignment performances and noise • Suspension control performances and noise • Environmental noise • Laser noise • Glitches search and identification • Lines identification • Quantify noise stationarity/gaussianity • Readout noise
Tools • Data are in the Common Data Frame Format for Interferometric Gravitational Wave Detectors Mostly handled with: • dataDisplay: data visualization and analysis • Siesta: simulation vs data • Vega: data visualization and analysis • Other (personal) softwares and/or libraries
dataDisplay dataDisplay: Virgo software for visualizing and analyze data • It is the most commonly tool used by commissioning people. • It allows on-line (in-time) data analysis and visualization • It allows visualization of measured and simulated data • It has ist own routines for analysis (FrVect: offsets, sum, multiplication, FFT, coherence,TF, etc.)
Siesta Siesta: Virgo software for simulation • C written code with C input cards • It allows the simulation of the whole interferometer (optics, mechanics, etc.) in the time domain • It has its own routines for analysis (FFT, coherence, TF, …) • It allows simulation of control loops: simulated data in frame format can be compared with the measured ones (e.g. with dataDisplay)
VEGA VEGA: Graphical software, based on ROOT (Cern), modified to handle data in the Frame format (Frame library and FrVect) Allows off-line data visualization and analysis • Less used by commissioning people than dataDisplay • It is linked to the Cernlib libraries for data analysis
Others Many people working in noise analysis have developed their own routines and libraries (Matlab, C and C++ software). Some examples: • Lines identification: Florence-Urbino • Non-linear, non-stationary: Nice, Urbino • Lines removal: LAPP • Whitening: EGO
Common library Since there is much dispersion, discussion is going on in Virgo in order to create a common library for noise (and data) analysis. For the moment no final common reference software has been established yet
North End b. Low Frequency Accelerometers Tri-axial, 0.2-200 Hz (Kinemetrics - “Episensors”) 3km 3km High Frequency Accelerometers Vertical Piezo, 10-10000 Hz (Bruel&Kjaer) West End b. MC End b. Central building Environmental sensors • Other Environmental probes: • Microphones • Magnetometers • Pressure probes • Humidity • Temperature • Weather station
LF seismic activity monitoring Episensor (tri-axial accelerometer) in the central Building Updated on web each 10 minutes Sea activity Human activity (road traffic on highway bridges) Human activity around the site
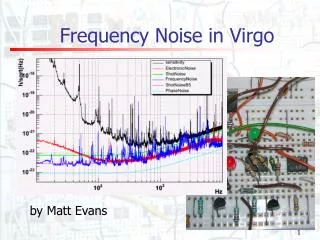
Mirror control noise MC length noise MC length control noise Electronic noise Shot noise C1 (North Arm)
MC length noise ADC noise MC length control noise Shot noise C2 (North Arm)
Noise at beginning of C2 Noise is higher than it was before the decreasing period Decrease of noise ZOOM C2: spectrogram 150 Hz-3 kHz
ZOOM Between 14h40 and 15h00, original conditions are restored Effect of the pump Between 13h22 (UTC) and 14h40, all pumps are progressively switched off At 13h59, IB pump switched off
C3 : scroll pumps OFF (IB), except 5min/day IB tower accelerometer C2 C3 Coherence with dark fringe Residual env. noise dominates mainly in [1500, 3000]Hz Turbo pump (mainly IB) ?
C2: Mirror internal modes identification • Coloured noise injected at the RM actuators of each mirror • ANSYS mirror simulation • Calibration software (CaRT) • One period at the NA and another at the WE • Mirror internal lines and quality factors measured
C2: North mirror internal modes identification NI: 3917.2 Hz 5584.7 Hz NE: 3883.0 Hz 5542.2 Hz
C4: Thermal noise Internal modes are now visible in the ITF output (recombined ITF) WE at 5545 Hz NE at 5543 Hz
C2 sensitivity limited by RFC noise C3 sensitivity now limited by another kind of noise With SSFS : RFC noise contribution is reduced FFT(Sc_NE_zGc) x Mechanical TF(NE) C3 (North Arm)
Pr_B1_ACp spectrum (April 23rd, 20:00:00 UTC ) Electronic Noise Shot Noise C3 (North Arm)
Sc_MC_txCorrM Sc_MC_txCorrR Sc_MC_tyCorrR Sc_MC_tyCorrM C3: Injection Bench lines (10 Hz< f < 100Hz) Input Bench resonances Good coherence around the IB resonances introduced in the sensitivity by the IMC AA loop
Pr_B1_ACp spectrum (April 27th, 12:20:00 UTC ) Electronic Noise (measured with shutter closed) Shot Noise Additional noise C3-Recombined: Electronic Noise
B8_phase/B8_DC Filter West arm Sc_WE_zCorr Gain Transfer function of the standard filter Static gain = 1.727 x 10ˆ9 frequency Hz C3-Recombined: West terminal photodiode (B8) noise Pr_B8_ACp limited by electronic noise above 200 Hz injected in sensitivity by the control loop Pr_B8_ACp used to acquire the lock of the West Cavity Coherence between B1_ACp & B8 _ACp sensitivity limited by B8 electronic noise between 200 Hz & 1 kHz
Standard filter New filter B8 noise model suits to sensitivity curve between 200 & 1000 Hz |gain| Roll off @ 300 Hz Phase New noise structures frequency C3-Recombined: West terminal photodiode (B8) noise
C3 Noise limitation to the sensitivity curve 1 - North arm • High frequencies : Electronic noise(?) or noise coming from the ITF (?) • Above 250 Hz : not well understood • Between 10 & 250 Hz : coherence with the correction signals used by the IMC • RFC noise (NA length control loop): does not limit C3 sensitivity, but could limit the sensitivity below 50 Hz for full VIRGO 2 - Recombined configuration • High frequencies : electronic noise • 200-1000 Hz : noise due to B8 • 10-100 Hz : “laser frequency noise” but is reduced at the end of the run
C4 General results about sensitivity (C4 data still to be discussed)
Summary • Virgo is not in its final configuration: Noise identification means debugging the progress of the activity • The commissiong activity for noise analysis is mainly concentrated on the data from the runs, in identifying the noise sources in the sensitivity curve • Many tools for analysing noise are present, discussion is going on for establishing a common library