Understanding Selected Investment Indexes: Insights on Long-Term Returns and Market Dynamics
410 likes | 529 Vues
This chapter explores various domestic and international investment indexes, focusing on their significance in the stock and bond markets. By examining U.S. price indexes including large and small company stocks, government bonds, and Treasury bills, we uncover long-term return trends and relationships between assets. Key objectives include utilizing indexes for rapid knowledge acquisition, asset allocation, and understanding economic relationships. The analysis also highlights how aggregated price indexes provide insights into market behaviors and diversifies investment risks.

Understanding Selected Investment Indexes: Insights on Long-Term Returns and Market Dynamics
E N D
Presentation Transcript
Selected Investment Indexes Chapter 11 Chapter 11: Selected Investment Indexes
Background • Chapter investigates domestic and international indexes for stock and bond markets • Objectives include using indexes to • Rapidly gain knowledge • Confront theories with facts • Investigate market inter-relationships • Allocate assets • Examine overall economic relationships Chapter 11: Selected Investment Indexes
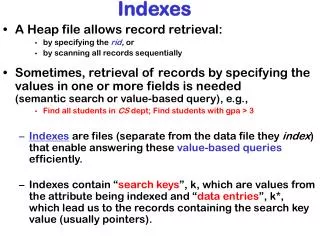
Long-Term Returns for Major Asset Classes • We’ll examine seven U.S. price indexes • Large company stocks (S&P500) • Long-term U.S. government bonds • Intermediate-term U.S. government bonds • U.S. Treasury bills • Small company stocks • Long-term corporate bonds • Inflation (percentage change in CPI) • Examine indexes because individual security prices reflect non-systematic events, whereas price indexes contain many different securities—a diversified portfolio • Allows examination of meaningful trends and relationship between categories of investments Chapter 11: Selected Investment Indexes
Ibbotson’s Seven Basic Indexes • Large company stock index • Measured by S&P500 Stocks Composite Index, using total returns • Annual compound growth of 11.3% from 1925-1999 • Dividends represent 4.5% and capital gains 6.6% • Annual returns fluctuated from a low of –43.3% (in 1933) to a high of 54.0% (in 1934) • Small company stock index • Annual compound growth of 12.6% from 1925 to 1999 • Range from low of –58.0% (in 1937) to 142.9% (in 1933) • The small stocks index shows that investors were rewarded with a high total return as compensation for the unique risk involved with small stock investing Chapter 11: Selected Investment Indexes
Ibbotson’s Seven Basic Indexes • Long-term corporate bond index • Annual compound growth rate of 5.6% • Range of –8.1% (in 1969) to 42.6% (in 1982) • Long-term government bond index • Annual compound growth rate of 5.1% • Range from –9.2% (in 1967) to 40.4% (in 1982) • Interestingly, the coupon income component of the Treasury bond’s total return is > 100%, as the price declines exceeded the price increases • Intermediate-term government bond index • Annual compound growth rate of 5.2% • Range from –5.1% (in 1994) to 29.1% (in 1982) • Return from income was 4.7% of the 5.2% total return Chapter 11: Selected Investment Indexes
Ibbotson’s Seven Basic Indexes • U.S. Treasury Bill index • Annual compound growth rate of 3.8% • Range from 0% (in 1938-1940) to 14.7% (in 1981) • Over the 74-year sample period, T-bill returns exceeded inflation rate by 0.6% (or 60 basis points) • Inflation in the U.S. • Compound annual inflation rate of 3.1% • Range from –10.3% (in 1932) to 18.2% (in 1946) • Deflation occurred during the Depression from 1926-1933 Chapter 11: Selected Investment Indexes
Wealth Accumulation • If you had invested $1 in the following from end of 1925 to end of 1999 it would have increased to Even a fairly small annual return can create large long- term results • Method of computation is (1 + return)n = Ending Wealth Chapter 11: Selected Investment Indexes
Wealth Accumulation • Inflation means that the purchasing power of $1 is not the same from year-to-year (it decreases) • $1 of purchases made in 1925 would cost $9.39 by 1999 • $1 x (1 + 0.030728)74 = $9.39 • Therefore, the $2,845.63 after adjusting for inflation is only worth ? in real terms • $2,845.63 $9.39 = $303.05 (or 1.113469 1.030728) • While the accumulated real wealth is much lower than the nominal wealth, it is still an impressive number Chapter 11: Selected Investment Indexes
The payoff from taking higher risk is evident. Risk and Return Chapter 11: Selected Investment Indexes
Risk and Return • Risk premiums represent the additional return expected by investors when they select a certain class of asset • Equities compared to bonds, for instance Chapter 11: Selected Investment Indexes
Common stocks enjoyed 4 bull markets • 1922-9/29 • 1949-1961 • mid 1982-10/87 • 1990s Risk and Return Rising inflation increased bond yields and created a bull market from 1981-1994 Inflation reached its peak in the 1970s Chapter 11: Selected Investment Indexes
Reinvestment Return • Bonds that pay a coupon have 3 different types of income • From cash flows • From capital appreciation (or depreciation) • From reinvestment • When calculating returns over multiple time periods, it is conventionally assumed that cash flows are reinvested as soon as received (reinvestment income) • Can represent a sizable portion of return, especially for bonds Chapter 11: Selected Investment Indexes
October 19, 1987 • On October 19, 1987 the international stock market crashed, suffering a 22.6% loss in the DJIA • However, the stock market index ended the 1980s with an overall gain • Therefore, large short-run price fluctuations may not be that important in the long-run Chapter 11: Selected Investment Indexes
The min and max returns become closer together. Maximum & Minimum Returns Chapter 11: Selected Investment Indexes
Maximum & Minimum Returns • The data on the previous slide suggest that, if you invest for longer time periods, the probability of earning a positive point increases • Mean reversion • If a return is at an extreme (either + or -) during one time period, it tends to revert toward the mean during a later period • Some argue that time diversification tends to average away some of the short-term fluctuations, thereby reducing risk Chapter 11: Selected Investment Indexes
Risk-Return Relationships The risk rankings correlate with the idea that small company stocks have the highest average return and Treasury bills the lowest. Chapter 11: Selected Investment Indexes
Intertemporal Stability of Volatility • It is desirable from a statistical viewpoint to have intertemporal stability (constancy through time) in standard deviations • However, this constancy is not evident on the previous slide • SDs exhibit heteroscedascity (instability) • This can yield erratic statistical estimates and cause problems with asset pricing models discussed later in text Chapter 11: Selected Investment Indexes
Cross Correlations • Financial analysts are interested in the way random variables interact, or co-vary • The correlation coefficient measures the inter-relationship between variables • +1.0 -1.0 Chapter 11: Selected Investment Indexes
Long-term and intermediate term bond indexes are highly positively correlated. The negative relationship between inflation and the other variables is due to (1) inflation has a positive impact on interest rates and (2) as interest rates rise, bond and stock prices decline. Cross Correlations Large & small company stocks tend to vary together closely. Bond and stock indexes tend to vary together weakly. Chapter 11: Selected Investment Indexes
Serial Correlation • Serial correlation (or autocorrelation) • Measures the extent to which the values in one series are related to leading or lagged values in the same time series of data • Positive serial correlation occurs when data moves in trends • Negative serial correlation occurs when data experiences reversals • Random numbers have a zero serial correlation Chapter 11: Selected Investment Indexes
Serial Correlation • Observations • Inflation moves in trends as do Treasury bills • The absence of serial correlation in the stock and long-term bond indexes suggests that these returns tend to fluctuate in a random fashion, making them difficult to forecast • Technicians disagree with this finding and claim they can discern useful patterns Chapter 11: Selected Investment Indexes
Historical Risk Premia • Risk premia are the incentives needed to encourage risk-averse investors to take various kinds of risk • Can use risk-premia to determine the appropriate discount rate in valuing assets • Real returns are inflation-adjusted returns • The nominal rate of return can be divided into the real rate and the inflation premium • Real rate = nominal rate – inflation • Real rate = 3.8% -3.2% = 0.6% Chapter 11: Selected Investment Indexes
Bond Horizon Premia • Long-term Treasury bond prices fluctuate differently from Treasury bills; therefore their returns differ • The bond horizon premium measures the additional return investors desire to induce them to hold T-bonds rather than shorter-term T-bills • ReturnT-bond = Riskless ReturnShort-Term T-bills + horizon premium • ReturnT-bond = 3.8% + 1.7% • ReturnT-bond = 5.5% Chapter 11: Selected Investment Indexes
Bond Default Premia • A long-term corporate bond’s return is composed of • Real riskless rate • Inflation premium • Horizon premium • Default premium (difference between returns on a long-term corporate bond and a long-term U.S. T-bond) Chapter 11: Selected Investment Indexes
Bond Default Premia • Default risk occurs if a bond issuer omits (or pays late) a coupon payment(s) • The portion of the bond default premium that remains after default losses are subtracted is called the pure default risk premium • Investors buying callable bonds face the risk that interest rates will decline and the bonds will be called • Empirical evidence suggest that call risk premia range from 5 – 30 basis points Chapter 11: Selected Investment Indexes
Expected Return • The expected return components for a non-callable long-horizon large corporate bond Total Bond Default Premium: 40 BPs Chapter 11: Selected Investment Indexes
Equity Risk Premia • Large company stock returns are composed of short-term riskless T-bill rate plus a risk premium for investing in equity • Short-horizon premium • Large stock total return – T-bill total return • 13.3% - 3.8% = 9.5% or 950 basis points • Long-horizon premium • Large stock total return – long-term T-bond return • 13.3% - 5.5% = 7.8% or 780 basis points • Intermediate-horizon premium • Large stock total return – intermediate T-bond return • 13.3% - 5.4% - 7.9% or 790 basis points • Small stock risk premium • Small stock total return – large stock total return • 17.6% - 13.3% - 4.3% or 430 basis points Note: Returns represent arithmetic means, not geometric means. Chapter 11: Selected Investment Indexes
Real Returns • Real returns represent nominal returns less the inflation premium When monthly returns are examined, find most portfolios occasionally have negative real returns. Therefore most asset categories are imperfect inflation hedges. Chapter 11: Selected Investment Indexes
Inflation-Related Issues • Money illusion occurs when investors do not realize that a part of one’s nominal return is lost to inflation • Example: $200,000 to be received in 10 years if inflation is 3% annually will be worth less than $200,000 in real terms Chapter 11: Selected Investment Indexes
International Stock Markets • Portfolio theory suggests the inclusion of international securities in portfolio • Non-U.S. financial markets use different methods of calculating returns, taxes, transaction costs and reinvestment assumptions, so direct comparison is difficult Chapter 11: Selected Investment Indexes
MSCI Indexes • In 1969 Morgan Stanley Capital International (MSCI) started a databank that today contains over 50 countries, including • All countries on previous slide plus many others, including • Argentina • Brazil • China • Greece • India • Korea • Mexico • Peru • Poland • Russia • South Africa • Taiwan • Turkey These represent emerging markets, which occur in countries with small new markets, low trading volume and low income. Chapter 11: Selected Investment Indexes
Market Indexes • Many local indexes exist for different countries • However, the MSCI indexes are statistically superior, especially for foreign investors • All the MSCI indexes are uniformly defined (compared to other indexes for which it is sometimes difficult to find detailed computational information) • Website: http://www.msci.com • Makes it easier to compare different countries Chapter 11: Selected Investment Indexes
Market Indexes • Comparison of Five Local Indexes with MSCI Indexes Chapter 11: Selected Investment Indexes
Emerging Market Indexes Based on five years of monthly total returns. Chapter 11: Selected Investment Indexes
Developed Market Indexes Based on five years of monthly total returns. Chapter 11: Selected Investment Indexes
Observations • Statistics are more heterogeneous and more unstable for emerging markets than for developed markets • Investing in emerging markets is far more risky than investing in developed countries • Emerging markets have lower correlations with the MSCI world market index, Emerging Markets Free index, Europe-Australasia-Far-East index and the European Monetary Union index • Developed nations trade more with each other than emerging markets nations, creating more undiversifiable risk in developed nations • Emerging markets have large standard deviations and more of their risk is diversifiable • statistically independent, uncorrelated Chapter 11: Selected Investment Indexes
Correlations Between Developed and Emerging Markets • Many investors analyze possibilities for international diversification across a number of different countries • However, if there is a great deal of correlation across countries, less diversification benefits will be achieved • Correlations between emerging markets are lower and less stable across time than for developed markets • Reflects the political and economic instability in many of these countries • International diversification offers more risk reduction possibilities to multi-national investors than is available to domestic investors Chapter 11: Selected Investment Indexes
Investing in Emerging Markets • Emerging markets offer the potential for high gain but at the cost of extremely high risk • Hinges on being at the right place at the right time • Most of the world’s capital markets are not long-term survivors • Most of the world’s capital markets have experienced closure due to wars, political upheaval, etc. Chapter 11: Selected Investment Indexes
The Bottom Line • Chapter summarizes statistics over 7 decades of investment in the U.S. as well as outside the U.S. (for shorter time periods) • Data is useful for • Providing inputs for real-life portfolio analysis • Comparing theoretical models and realistic values • Establishing standards of comparison Chapter 11: Selected Investment Indexes
The Bottom Line • Based on the data contained in the this chapter, we’ve reached the following conclusions • A positive relationship exists between risk and return throughout the world’s financial markets • This provides strong evidence that investors are risk averse • Equities are riskier and provide higher returns than debt • Re-investing cash flows can usually increase total returns • Inflation erodes the purchasing power of investors’ wealth • Covariances, cross correlations and serial correlations are useful statistics for measuring the behavior of random variables • Corporate bond returns contain a default risk premium Chapter 11: Selected Investment Indexes
The Bottom Line • Equities provide higher inflation-adjusted returns than debt • U.S. Treasury bills earns returns only slightly above inflation • International investing is riskier than domestic investing • Emerging market investing is riskier than developed market investing • Emerging market investing may earn an investor higher risk premiums Chapter 11: Selected Investment Indexes