CHAPTER 1 Exploring Data
CHAPTER 1 Exploring Data. 1.1 Analyzing Categorical Data. Categorical variables place individuals into one of several groups or categories. *The values of a categorical variable are labels for the different categories, such as “male” and “female.”

CHAPTER 1 Exploring Data
E N D
Presentation Transcript
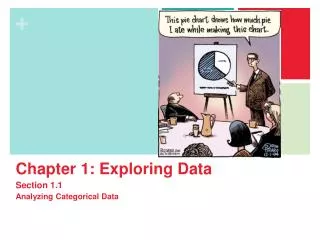
CHAPTER 1Exploring Data 1.1Analyzing Categorical Data
Categorical variables place individuals into one of several groups or categories. *The values of a categorical variable are labels for the different categories, such as “male” and “female.” *The distribution of a categorical variable lists the count or percent of individuals who fall into each category. Variable Values Count Percent
Example 1: The radio audience rating service Arbitron places U.S radio stations into categories that describe the kinds of programs they broadcast. Here are two different tables showing the distribution of station formats in a recent year:
In this case, the individuals are the radio stations and the variable being measured is the kind of programming that each station broadcasts. The table on the left, which we call a frequency table, displays the counts (frequencies) of stations in each format category. On the right, we see a relative frequency table of the data that shows the percents (relative frequencies) of stations in each format category. It’s a good idea to check data for consistency. The counts should add to 13,838, the total number of stations. They do. The percents should add to 100%. In fact, they add to 99.9%. What happened? Each percent is rounded to the nearest tenth. The exact percents would add to 100, but the rounded percents only come close. This isroundoff error.Roundoff errors don’t point to mistakes in our work, just to the effect of rounding off results.
Displaying Categorical Data Frequency tables can be difficult to read. Sometimes is is easier to analyze a distribution by displaying it with a bar graph or pie chart.
Example 2: Portable MP3 music players, such as the Apple iPod, are popular—but not equally popular with people of all ages. Here are the percents of people in various age groups who own a portable MP3 player, according to an Arbitron survey of 1112 randomly selected people.
a) Make a well-labeled bar graph to display the data. Describe what you see. • It appears that MP3 players are more popular among young people and that their popularity generally decreases as the age category increases.
b) Would it be appropriate to make a pie chart for these data? Explain. Making a pie chart to display these data is not appropriate because each percent in the table refers to a different age group, not to parts of a single whole.
Graphs: Good and Bad Bar graphs compare several quantities by comparing the heights of bars that represent those quantities. Our eyes, however, react to the area of the bars as well as to their height. When you draw a bar graph, make the bars equally wide. It is tempting to replace the bars with pictures for greater eye appeal. Don’t do it! • There are two important lessons to keep in mind: • beware the pictograph, and • watch those scales.
Two-Way Tables and Marginal Distributions When a dataset involves two categorical variables, we begin by examining the counts or percents in various categories for one of the variables. A two-way table describes two categorical variables, organizing counts according to a row variable and a column variable.
Example 3: A survey of 4826 randomly selectedyoung adults (aged 19 – 25) asked, “What do you think are the chances you will have much more than a middle-class income at age 30?” The table below shows the responses. • What are the variables described by this • two-way table? • Gender and opinion about becoming rich. • How many young adults were surveyed? • 4,826 This is a two-way table because it describes two categorical variables, gender and opinion about becoming rich. Opinion is the row variable because each row in the table describes young adults who held one of the five opinions about their chances. Because the opinions have a natural order from “Almost no chance” to “Almost certain,” the rows are also in this order. Gender is the column variable. The entries in the table are the counts of individuals in each opinion-by-gender class.
Two-Way Tables and Marginal Distributions The marginal distribution of one of the categorical variables in a two-way table of counts is the distribution of values of that variable among all individuals described by the table. Note: Percents are often more informative than counts, especially when comparing groups of different sizes. How to examine a marginal distribution: *Use the data in the table to calculate the marginal distribution (in percents) of the row or column totals. *Make a graph to display the marginal distribution.
Example 3 continued: a) Use the data in the two-way table to calculate the marginal distribution (in percents) of opinions.
Example 3 continued: b) Make a graph to display the marginal distribution. Describe what you see. It seems that many young adults are optimistic about their future income. Over 50% of those who responded to the survey felt that they had “a good chance” or were “almost certain” to be rich by age 30.
Relationships Between Categorical Variables A conditional distribution of a variable describes the values of that variable among individuals who have a specific value of another variable. • How to examine or compare conditional distributions: • *Select the row(s) or column(s) of interest. • *Use the data in the table to calculate the conditional distribution (in percents) of the row(s) or column(s). • *Make a graph to display the conditional distribution. • _Use a side-by-side bar graph or segmented bar graph to compare distributions.
Example 4: Calculate the conditional distribution of opinion among the young men. • Examine the relationship between gender and opinion.
Which conditional distributions should we compare? Our goal all along has been to analyze the relationship between gender and opinion about chances of becoming rich for these young adults. We started by examining the conditional distributions of opinion for males and females. Then we looked at the conditional distributions of gender for each of the five opinion categories. Which of these two gives us the information we want? Here’s a hint: think about whether changes in one variable might help explain changes in the other. In this case, it seems reasonable to think that gender might influence young adults’ opinions about their chances of getting rich. To see whether the data support this idea, we should compare the conditional distributions of opinion for women and men.
Example 5: Based on the survey data, can we conclude that young men and women differ in their opinions about the likelihood of future wealth? Give appropriate evidence to support your answer. We suspect that gender might influence a young adult’s opinion about the chance of getting rich. So we’ll compare the conditional distributions of response for men alone and for women alone.
We’ll make a side-by-side bar graph to compare the opinions of males and females. Based on the sample data, men seem somewhat more optimistic about their future income than women. Men were less likely to say that they have “some chance but probably not” than women (11.6% vs. 18.0%). Men were more likely to say that they have “a good chance” (30.8% vs. 28.0%) or are “almost certain” (24.3% vs. 20.5%)to have much more than a middle-class income by age 30 than women were.
Caution! Even a strong association between two categorical variables can be influenced by other variables lurking in the background.