Download
1 / 29
290 likes | 467 Vues
CHAPTER 1 Exploring Data. 1.3 Describing Quantitative Data with Numbers. Measuring Center: The Mean. The most common measure of center is the ordinary arithmetic average, or mean.

E N D
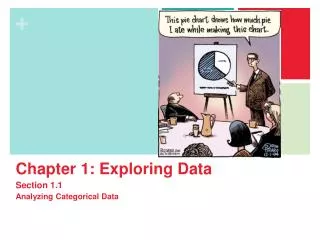
CHAPTER 1Exploring Data 1.3Describing Quantitative Data with Numbers
Measuring Center: The Mean The most common measure of center is the ordinary arithmetic average, or mean. To find the mean (pronounced “x-bar”) of a set of observations, add their values and divide by the number of observations. If the n observations are x1, x2, x3, …, xn, their mean is: In mathematics, the capital Greek letter Σ is short for “add them all up.” Therefore, the formula for the mean can be written in more compact notation:
Example 1: Here is a stemplot of the travel times to work for the sample of 15 North Carolinians. a) Find the mean travel time for all 15 workers.
b) Calculate the mean again, this time excluding the person who reported a 60-minute travel time to work. What do you notice? This one observation raises the mean by 2.7 minutes.
Measuring Center: The Median Another common measure of center is the median. The median describes the midpoint of a distribution. The median,M,is the midpoint of a distribution, the number such that half the observations are smaller and the other half are larger. The medianis the midpoint of a distribution, the number such that half of the observations are smaller and the other half are larger. To find the median of a distribution: *Arrange all observations from smallest to largest. *If the number of observations n is odd, the median is the center observation in the ordered list. *If the number of observations n is even, the median is the average of the two center observations in the ordered list. Medians require little arithmetic, so they are easy to find by hand for small sets of data. Arranging even a moderate number of values in order is tedious, however, so finding the median by hand for larger sets of data is unpleasant.
Example 2: What is the median travel time for our 15 North Carolina workers? Here are the data arranged in order: 5 10 10 10 10 12 15 20 20 25 30 30 40 40 60 The count of observations n = 15 is odd. The bold 20 is the center observation in the ordered list, with 7 observations to its left and 7 to its right. This is the median, 20 minutes.
Example 3: People say that it takes a long time to get to work in New York State due to the heavy traffic near big cities. What do the data say? Here are the travel times in minutes of 20 randomly chosen New York workers: a) Make a stemplot of the data. Be sure to include a key.
b) Find the median by hand. Show your work. Because there is an even number of data values, there is no center observation. There is a center pair—the bold 20 and 25 in the stemplot—which have 9 observations before them and 9 after them in the ordered list. The median is the average of these two observations:
Comparing the Mean and the Median Our discussion of travel times to work in North Carolina illustrates an important difference between the mean and the median. The median travel time (the midpoint of the distribution) is 20 minutes. The mean travel time is higher, 22.5 minutes. The mean is pulled toward the right tail of this right-skewed distribution. The median, unlike the ean, is resistant. If the longest travel time were 600 minutes rather than 60 minutes, the mean would increase to more than 58 minutes but the median would not change at all. The outlier just counts as one observation above the center, no matter how far above the center it lies. The mean uses the actual value of each observation and so will chase a single large observation upward.
Comparing the Mean and the Median The mean and median measure center in different ways, and both are useful. Don’t confuse the “average” value of a variable (the mean) with its “typical” value, which we might describe by the median. The mean and median of a roughly symmetric distribution are close together. If the distribution is exactly symmetric, the mean and median are exactly the same. In a skewed distribution, the mean is usually farther out in the long tail than is the median.
Measuring Spread: The Interquartile Range (IQR) A measure of center alone can be misleading. A useful numerical description of a distribution requires both a measure of center and a measure of spread. How To Calculate The Quartiles And The IQR: To calculate the quartiles: *Arrange the observations in increasing order and locate the median. *The first quartile Q1is the median of the observations located to the left of the median in the ordered list. *The third quartile Q3 is the median of the observations located to the right of the median in the ordered list. *The interquartile range (IQR) is defined as: IQR = Q3 – Q1 Be careful in locating the quartiles when several observations take the same numerical value. Write down all the observations, arrange them in order, and apply the rules just as if they all had distinct values.
Example 4: In an earlier example, we looked at data on travel times to work for 20 randomly selected New Yorkers. Here is the stemplot once again: Find and interpret the interquartile range (IQR).
Median = 22.5 Q3= 42.5 Q1= 15 IQR = Q3 – Q1 = 42.5– 15 = 27.5 minutes Interpretation: The range of the middle half of travel times for the New Yorkers in the sample is 27.5 minutes.
Identifying Outliers In addition to serving as a measure of spread, the interquartile range (IQR) is used as part of a rule of thumb for identifying outliers. The 1.5 x IQR Rule for Outliers Call an observation an outlier if it falls more than 1.5 x IQR above the third quartile or below the first quartile.
Example 5: Earlier, we noted the influence of one long travel time of 60 minutes in our sample of 15 North Carolina workers. Determine whether this value is an outlier. There is an odd number of observations, so the median is the middle one, the bold 20 in the list. The first quartile is the median of the 7 observations to the left of the median. This is the 4th of these 7 observations, so Q1 = 10 minutes (shown in blue).The third quartile is the median of the 7 observations to the right of the median, Q3= 30 minutes (shown in green). So the spread of the middle 50% of the travel times is IQR = Q3 − Q1 = 30 − 10 = 20 minutes. Be sure to leave out the overall median when you locate the quartiles.
Q1= 10 minutes, Q3 = 30 minutes, and IQR = 20 minutes. For these data, 1.5 x IQR = 1.5(20) = 30 Q1–1.5 x IQR = 10 – 30 = –20 Q3+ 1.5 x IQR = 30 + 30 = 60 Any travel time shorter than –20 minutes or longer than 60 minutes is considered an outlier. AP EXAM TIP: You may be asked to determine whether a quantitative data set has any outliers. Be prepared to state and use the rule for identifying outliers.
The Five-Number Summary *The minimum and maximum values alone tell us little about the distribution as a whole. Likewise, the median and quartiles tell us little about the tails of a distribution. *To get a quick summary of both center and spread, combine all five numbers. These five numbers divide each distribution roughly into quarters. About 25% of the data values fall between the minimum and Q1, about 25% are between Q1 and the median, about 25% are between the median and Q3, and about 25% are between Q3 and the maximum. The five-number summaryof a distribution consists of the smallest observation, the first quartile, the median, the third quartile, and the largest observation, written in order from smallest to largest. Minimum Q1 Median Q3 Maximum
Boxplots (Box-and-Whisker Plots) The five-number summary divides the distribution roughly into quarters. This leads to a new way to display quantitative data, the boxplot. How To Make A Boxplot: *A central box is drawn from the first quartile (Q1) to the third quartile (Q3). *A line in the box marks the median. *Lines (called whiskers) extend from the box out to the smallest and largest observations that are not outliers. *Outliers are marked with a special symbol such as an asterisk (*).
Example 6: Barry Bonds set the major league record by hitting 73 home runs in a single season in 2001. On August 7, 2007, Bonds hit his 756th career home run, which broke Hank Aaron’s longstanding record of 755. By the end of the 2007 season when Bonds retired, he had increased the total to 762. Here are data on the number of home runs that Bonds hit in each of his 21 complete seasons: 16 25 24 19 33 25 34 46 37 33 42 40 37 34 49 73 46 45 45 26 28
Let’s start by ordering the data values so that we can find the five-number summary. Now we check for outliers. Because IQR = 45 − 25.5 = 19.5, by the 1.5 × IQRrule, any value greater than Q3 + 1.5 × IQR = 45 + 1.5 × 19.5 = 74.25 or less than Q1 − 1.5 × IQR = 25.5 − 1.5 × 19.5 = −3.75 would be classified as an outlier. So there are no outliers in this data set. Now we are ready to draw the boxplot. See the finished graph at left.
Measuring Spread: The Standard Deviation The most common measure of spread looks at how far each observation is from the mean. This measure is called the standard deviation. The standard deviationsxmeasures the average distance of the observations from their mean. It is calculated by finding an average of the squared distances and then taking the square root. The average squared distance is called the variance.
Here’s a brief summary of the process for calculating the standard deviation. How to find the Standard Deviation To find the standard deviation of n observations: 1. Find the distance of each observation from the mean and square each of these distances. 2. Average the distances by dividing their sum by n − 1. 3. The standard deviation sx is the square root of this average squared distance: Many calculators report two standard deviations, giving you a choice of dividing by n or by n − 1. The former is usually labeled σx, the symbol for the standard deviation of a population. If your data set consists of the entire population, then it’s appropriate to use σx.
More often, the data we’re examining come from a sample. In that case, we should use sx. More important than the details of calculating sx are the properties that determine the usefulness of the standard deviation: *sx measures spread about the mean and should be used only when the mean is chosen as the measure of center. *sx is always greater than or equal to 0. sx = 0 only when there is no variability. This happens only when all observations have the same value. Otherwise, sx > 0. As the observations become more spread out about their mean, sx gets larger. *sx has the same units of measurement as the original observations. For example, if you measure metabolic rates in calories, both the mean and the standard deviation sx are also in calories. This is one reason to prefer sx to the variance , which is in squared calories. *Like the mean , sx is not resistant. A few outliers can make sx very large. The use of squared deviations makes sx even more sensitive than to a few extreme observations. For example, the standard deviation of the travel times for the 15 North Carolina workers is 15.23 minutes. If we omit the maximum value of 60 minutes, the standard deviation drops to 11.56 minutes.
Choosing Measures of Center and Spread We now have a choice between two descriptions for center and spread Mean and Standard Deviation Median and Interquartile Range Choosing Measures of Center and Spread *The median and IQR are usually better than the mean and standard deviation for describing a skewed distribution or a distribution with outliers. *Use mean and standard deviation only for reasonably symmetric distributions that don’t have outliers. *NOTE: Numerical summaries do not fully describe the shape of a distribution. ALWAYS PLOT YOUR DATA! AP EXAM TIP: Use statistical terms carefully and correctly on the AP exam. Don’t say “mean” if you really mean “median.” Range is a single number; so are Q1, Q3, and IQR. Avoid colloquial use of language, like “the outlier skews the mean.” Skewed is a shape. If you misuse a term, expect to lose some credit.
Organizing a Statistical Problem As you learn more about statistics, you will be asked to solve more complex problems. Here is a four-step process you can follow. How to Organize a Statistical Problem: A Four-Step Process State: What’s the question that you’re trying to answer? Plan: How will you go about answering the question? What statistical techniques does this problem call for? Do: Make graphs and carry out needed calculations. Conclude: Give your conclusion in the setting of the real-world problem.
Example 7: For their final project, a group of AP Statistics students wanted to compare the texting habits of males and female. They asked a random sample of students from their school to record the number of text messages sent and received over a two-day period. Here are their data: What conclusion should the students draw? Give appropriate evidence to support your answer. Do males and females at the school differ in their texting habits? STATE: Do males and females at the school differ in their texting habits. PLAN: We’ll begin by making parallel boxplots of the data about males and females. Then we’ll calculate one-variable statistics. Finally, we’ll compare shape, center, spread, and outliers for the two distributions.
DO:The figure below is a sketch of the boxplots we got from our calculator. The table below shows numerical summaries for males and females.
Due to the strong skewness and outliers, we’ll use the median and IQR instead of the mean and standard deviation when comparing center and spread. Shape: Both distributions are strongly right-skewed. Center: Females typically text more than males. The median number of texts for females (107) is about four times as high as for males (28). In fact, the median for the females is above the third quartile for the males. This indicates that over 75% of the males texted less than the “typical” (median) female. Spread: There is much more variation in texting among the females than the males. TheIQR for females (157) is about twice the IQR for males (77). Outliers: There are two outliers in the male distribution: students who reported 213 and 214 texts in two days. The female distribution has no outliers.
CONCLUDE: The data from this survey project give very strong evidence that male and female texting habits differ considerably at the school. A typical female sends and receives about 79 more text messages in a two-day period than a typical male. The males as a group are also much more consistent in their texting frequency than the females.