Download
1 / 18
180 likes | 292 Vues
Thinking is more important than knowing!. Richard Corbridge: Chief Information Officer richard.corbridge@nihr.ac.uk @R1chardatron www.richardcorbridge.com. Thinking, Knowing, Looking Insight at a glance .

E N D
Thinking is more important than knowing! Richard Corbridge: Chief Information Officer richard.corbridge@nihr.ac.uk @R1chardatron www.richardcorbridge.com
Thinking, Knowing, Looking Insight at a glance • “A compass, I learned when I was surveying, ...it'll point you True North from where you're standing, but it's got no advice about the swamps and deserts and chasms that you'll encounter along the way. If in pursuit of your destination, you plunge ahead, heedless of obstacles, and achieve nothing more than to sink in a swamp... What's the use of knowing True North?” • - Abraham Lincoln “Thinking is more interesting than knowing, but less interesting than looking” - Johann Wolfgang von Goethe
Thinking, Knowing, Looking Insight at a glance Alignment of the planets Customers as fans The power of knowing and looking UK Landscape The origins of looking first
Looking first Origins Business Analytics and Intelligence started in the provision of Health and Social Care. Dr John Snow and the story of the discovery of how Cholera was transmitted in London in 1854.
UK Landscape NIHR CRN 2014 All systems in place to support research. Delivery of the final components of the research Information Strategy GOAL All processes improved through access to ‘modern’ information systems and a change in culture A ‘basecamp’ of policy, education and resources has been achieved.
UK Landscape Where did we come from… TECHNOLOGY and INFORMATION are now more than ever ingrained in all that is done throughout the world and we must adopt all elements of them or risk falling behind the KNOWLEDGE curve. Clinical Research Network – January 2013 • Approximately 55 different systems in place • Around 35 different ways of collating reports • 16 different topic-wide databases • Significant bespoke reporting • Data debate • System based and system led change
UK Landscape Where are we now… ‘Google-verse’ Open Data Platform Local Portfolio Management System (SoC) Central Portfolio Management System Reference Data Service – Core system for providing all ‘meta data’ and reference data to our systems and other systems Strategy Facilitate collaboration, create a fan base of the systems and make the most of the connected data. Turn data into information that enables insight and facilitates more questions.
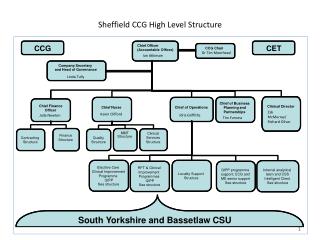
UK Landscape Where are we now… CPMS NIHRCentral Portfolio Management LCRN LCRN LCRN LPMS DGH Trust GP MH CSG CTU Industry
UK Landscape A new outlook… If data is used it is ‘controlled’… Aboriginal ‘land law’ states that if a person takes care of land, needs it to sustain family, and makes better use of it than the next person then they control the land. If we make good use of the data we have we will be seen to control it, own it and make use of it to deliver better care, outcomes & research.
Power in knowing Open Data Platform Granular view of target HLO 2a. Increase proportion of studies Select dashboard for particular network/yr/mth Drilldown further into a particular study area/category
Power in looking Open Data Platform Find a study in a particular geography / mile radius for a specialty / disease area
Customers as fans Empower the data voyeur Take the Aga and its customer culture … Delivery of Business Intelligence as a product that has fans rather than customers. Culture change through demand of the fan not through command and control.
Customers as fans Sell the sizzle Sell the sizzle not the sausage. Concentrate on the benefit not the product. Get to the natural state of analytics and the results you can gain, not the sausage.
Alignment of the planets Imagine a world
Imagine a w Alignment of the planets Thinking and looking Planet Information Systems Integration or Interoperable Modern Systems Information Realisation Information Security Planet Data Quality Reference Data Shared Data Veracity of Data Planet Information Analytics Information Analytics capability Network wide