Atmospheric Mercury Model Intercomparisons
580 likes | 738 Vues
Atmospheric Mercury Model Intercomparisons. Dr. Mark Cohen NOAA Air Resources Laboratory 1315 East West Highway, R/ARL, Room 3316 Silver Spring, Maryland, 20910 mark.cohen@noaa.gov http://www.arl.noaa.gov/ss/transport/cohen.html. Presentation at Collaborative Meeting on Modeling Mercury

Atmospheric Mercury Model Intercomparisons
E N D
Presentation Transcript
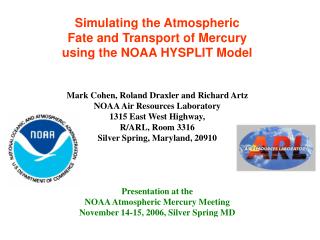
Atmospheric Mercury Model Intercomparisons Dr. Mark Cohen NOAA Air Resources Laboratory 1315 East West Highway, R/ARL, Room 3316 Silver Spring, Maryland, 20910 mark.cohen@noaa.gov http://www.arl.noaa.gov/ss/transport/cohen.html Presentation at Collaborative Meeting on Modeling Mercury in Freshwater Environments Niagara Falls, NY, January 19-20, 2006
Atmospheric Mercury Model Intercomparisons Comparison of Utility Contributions to the Great Lakes: HYSPLIT-Hg vs. CMAQ-Hg EMEP Mercury Model Intercomparison Local Deposition Comparison: HYSPLIT-Hg vs. ISC (Gaussian Plume) Summary 2
Atmospheric Mercury Model Intercomparisons Comparison of Utility Contributions to the Great Lakes: HYSPLIT-Hg vs. CMAQ-Hg EMEP Mercury Model Intercomparison Local Deposition Comparison: HYSPLIT-Hg vs. ISC (Gaussian Plume) Summary 3
Participants D. Syrakov ……………………………..Bulgaria…. NIMH A. Dastoor, D. Davignon ………………Canada...... MSC-Can J. Christensen…………………………. Denmark…NERI G. Petersen, R. Ebinghaus…………......Germany…GKSS J. Pacyna ………………………………. Norway….. NILU J. Munthe, I. Wängberg ……………….. Sweden….. IVL R. Bullock ………………………………USA………EPA M. Cohen, R. Artz, R. Draxler ………… USA………NOAA C. Seigneur, K. Lohman ………………..USA……... AER/EPRI A. Ryaboshapko, I. Ilyin, O.Travnikov…EMEP…… MSC-E 4
Intercomparison Conducted in 3 Stages • Comparison of chemical schemes for a cloud environment • Air Concentrations in Short Term Episodes • Long-Term Deposition and Source-Receptor Budgets 5
Intercomparison Conducted in 3 Stages • Comparison of chemical schemes for a cloud environment • Air Concentrations in Short Term Episodes • Long-Term Deposition and Source-Receptor Budgets 7
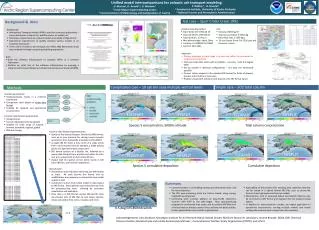
Atmospheric Mercury Elemental Mercury [Hg(0)] cloud Hg(II), Reactive Gaseous Mercury [RGM] Particulate Mercury [Hg(p)] CLOUD DROPLET Hg(II) reducedto Hg(0) by SO2 and sunlight Vapor phase Hg(0) oxidized to RGM and Hg(p) by O3, H202, Cl2, OH, HCl Adsorption/ desorption of Hg(II) to /from soot Hg(p) Hg(p) Dissolution? Primary Anthropogenic Emissions Hg(0) oxidized to dissolved Hg(II) species by O3, OH, HOCl, OCl- Re-emission of previously deposited mercury Natural emissions Wet and Dry Deposition 8
Stage I Publications: 2001 Ryaboshapko, A., Ilyin, I., Bullock, R., Ebinghaus, R., Lohman, K., Munthe, J., Petersen, G., Seigneur, C., Wangberg, I. Intercomparison Study of Numerical Models for Long Range Atmospheric Transport of Mercury. Stage I. Comparisons of Chemical Modules for Mercury Transformations in a Cloud/Fog Environment. Meteorological Synthesizing Centre – East, Moscow, Russia. 2002 Ryaboshapko, A., Bullock, R., Ebinghaus, R., Ilyin, I., Lohman, K., Munthe, J., Petersen, G., Seigneur, C., Wangberg, I. Comparison of Mercury Chemistry Models. Atmospheric Environment36, 3881-3898. 10
Intercomparison Conducted in 3 Stages • Comparison of chemical schemes for a cloud environment • Air Concentrations in Short Term Episodes • Long-Term Deposition and Source-Receptor Budgets 11 11
Mace Head, Ireland grassland shore Aspvreten, Sweden forested shore Rorvik, Sweden forested shore Zingst, Germany sandy shore Neuglobsow, Germany forested area Anthropogenic Mercury Emissions Inventoryand Monitoring Sites for Phase II(note: only showing largest emitting grid cells) 13
Mace Head Aspvreten Rorvik Zingst Neuglobsow 14
Neuglobsow NW S SE N NW N NW NW Total Gaseous Mercury at Neuglobsow: June 26 – July 6, 1995 15
Total Gaseous Mercury (ng/m3) at Neuglobsow: June 26 – July 6, 1995 16
Using alternative emissions inventory Total Gaseous Mercury (ng/m3) at Neuglobsow: June 26 – July 6, 1995 The emissions inventory is a critical input to the models… Using default emissions inventory 17
Total Particulate Mercury (pg/m3) at Neuglobsow, Nov 1-14, 1999 18
EMEP Intercomparison Study of Numerical Models for Long-Range Atmospheric Transport of Mercury Intro-duction Stage I Stage II Stage III Conclu-sions Chemistry Hg0 Hg(p) RGM Wet Dep Dry Dep Budgets Reactive Gaseous Mercury at Neuglobsow, Nov 1-14, 1999 19
EMEP Intercomparison Study of Numerical Models for Long-Range Atmospheric Transport of Mercury Intro-duction Stage I Stage II Stage III Conclu-sions Chemistry Hg0 Hg(p) RGM Wet Dep Dry Dep Budgets TGM: all within a factor of 1.35 RGM: 90% within a factor of 10 TPM: 90% within a factor of 2.5 RGM: 50% within a factor of 2 Deviation Factor Overall Phase II statistics for 2-week episode means TGM: 2-week mean concentrations within factor of 1.35 TPM: 90% within factor of 2.5 RGM:90% within a factor of 10; 50% within a factor of 2 20
Stage II Publications: 2003 Ryaboshapko, A., Artz, R., Bullock, R., Christensen, J., Cohen, M., Dastoor, A., Davignon, D., Draxler, R., Ebinghaus, R., Ilyin, I., Munthe, J., Petersen, G., Syrakov, D. Intercomparison Study of Numerical Models for Long Range Atmospheric Transport of Mercury. Stage II. Comparisons of Modeling Results with Observations Obtained During Short Term Measuring Campaigns. Meteorological Synthesizing Centre – East, Moscow, Russia. 2005 Ryaboshapko, A., Bullock, R., Christensen, J., Cohen, M., Dastoor, A., Ilyin, I., Petersen, G., Syrakov, D., Artz, R., Davignon, D., Draxler, R., and Munthe, J. Intercomparison Study of Atmospheric Mercury Models. Phase II. Comparison of Models with Short-Term Measurements. Submitted to Atmospheric Environment. 21
Intercomparison Conducted in 3 Stages • Comparison of chemical schemes for a cloud environment • Air Concentrations in Short Term Episodes • Long-Term Deposition and Source-Receptor Budgets 22 22
Due to resource constraints, not all models simulated the entire year 1999… 24
~100% within a factor of 10 ~80% within a factor of 3 ~60% within a factor of 2 ~90% within a factor of 5 Wet Deposition Summary 26
For dry deposition, there are no measurement results to compare the models against; • However, the models can be compared against each other… 27
Main items of mercury atmospheric balance for the UK in 1999, t/yr 29
Items of Hg atmospheric balances for the countries in 1999, t/yr[average modeled result (with ranges in parentheses)] 30
Stage III Publication: 2005 Ryaboshapko, A., Artz, R., Bullock, R., Christensen, J., Cohen, M., Draxler, R., Ilyin, I., Munthe, J., Pacyna, J., Petersen, G., Syrakov, D., Travnikov, O. Intercomparison Study of Numerical Models for Long Range Atmospheric Transport of Mercury. Stage III. Comparison of Modelling Results with Long-Term Observations and Comparison of Calculated Items of Regional Balances. Meteorological Synthesizing Centre – East, Moscow, Russia. 31
Atmospheric Mercury Model Intercomparisons Comparison of Utility Contributions to the Great Lakes: HYSPLIT-Hg vs. CMAQ-Hg EMEP Mercury Model Intercomparison Local Deposition Comparison: HYSPLIT-Hg vs. ISC (Gaussian Plume) Summary 32
Calculated from data used to produce Appendix A of USEPA (2005): Clean Air Mercury Rule (CAMR) Technical Support Document: Methodology Used to Generate Deposition, Fish Tissue Methylmercury Concentrations, and Exposure for Determining Effectiveness of Utility Emissions Controls: Analysis of Mercury from Electricity Generating Units 33
HYSPLIT 1996 Different Time Periods and Locations, but Similar Results ISC: 1990-1994 34
Atmospheric Mercury Model Intercomparisons Comparison of Utility Contributions to the Great Lakes: HYSPLIT-Hg vs. CMAQ-Hg EMEP Mercury Model Intercomparison Local Deposition Comparison: HYSPLIT-Hg vs. ISC (Gaussian Plume) Summary 35
CMAQ-Hg results from EPA analysis performed for the Clean Air Mercury Rule Modeled Mercury Deposition in the Great Lakes Region from all sources during 2001 Modeled Mercury Deposition in the Great Lakes Region attributable to U.S. coal-fired power plants during 2001
Model-estimated U.S. utility atmospheric mercury deposition contribution to the Great Lakes: HYSPLIT-Hg (1996 meteorology, 1999 emissions) vs. CMAQ-HG (2001 meteorology, 2001 emissions). 39
Model-estimated U.S. utility atmospheric mercury deposition contribution to the Great Lakes: HYSPLIT-Hg (1996 meteorology, 1999 emissions) vs. CMAQ-Hg (2001 meteorology, 2001 emissions). • This figure also shows an added component of the CMAQ-Hg estimates -- corresponding to 30% of the CMAQ-Hg results – in an attempt to adjust the CMAQ-Hg results to account for the deposition underprediction found in the CMAQ-Hg model evaluation. 40
Atmospheric Mercury Model Intercomparisons Comparison of Utility Contributions to the Great Lakes: HYSPLIT-Hg vs. CMAQ-Hg EMEP Mercury Model Intercomparison Local Deposition Comparison: HYSPLIT-Hg vs. ISC (Gaussian Plume) Summary 41
Summary of Model Intercomparisons • Extremely useful for improving models • Opportunity to work together and pool resources (e.g., everyone doesn’t have to create their own inventory or assemble monitoring data for evaluation) • Funding is a problem… most studies do not fund the individual participants…. • 10% of the work is doing the initial modeling analysis; • 90% of the work is trying to figure out why the models are different – but we rarely have the resources to do much of this
Extra Slides
Effect of Different Assumptions Regarding Hg(p) SolubilityAER/EPRI 0%; MSCE-EMEP 50%; CMAQ-EPA 100% 45
European anthropogenic Hg re-emissions 50 t/yr European natural Hg emissions 180 t/yr 2000 European anthropogenic Hg emissions 240 t/yr
global natural Hg emissions 1800 t/yr 1995 global anthropogenic Hg emissions 1900 t/yr
There are uncertainties in measurements -- even of precipitation amount… 48