Download
1 / 26
260 likes | 278 Vues
Explore the economic and social landscape of Lithuania, covering GDP evaluation, unemployment, living standards, emigration trends, and more. This comprehensive report delves into the impacts of austerity measures, demographic shifts, and labor market challenges the country faces. Gain insights into income trends, social benefits, and the path to addressing economic issues for sustainable growth and social progress.

E N D
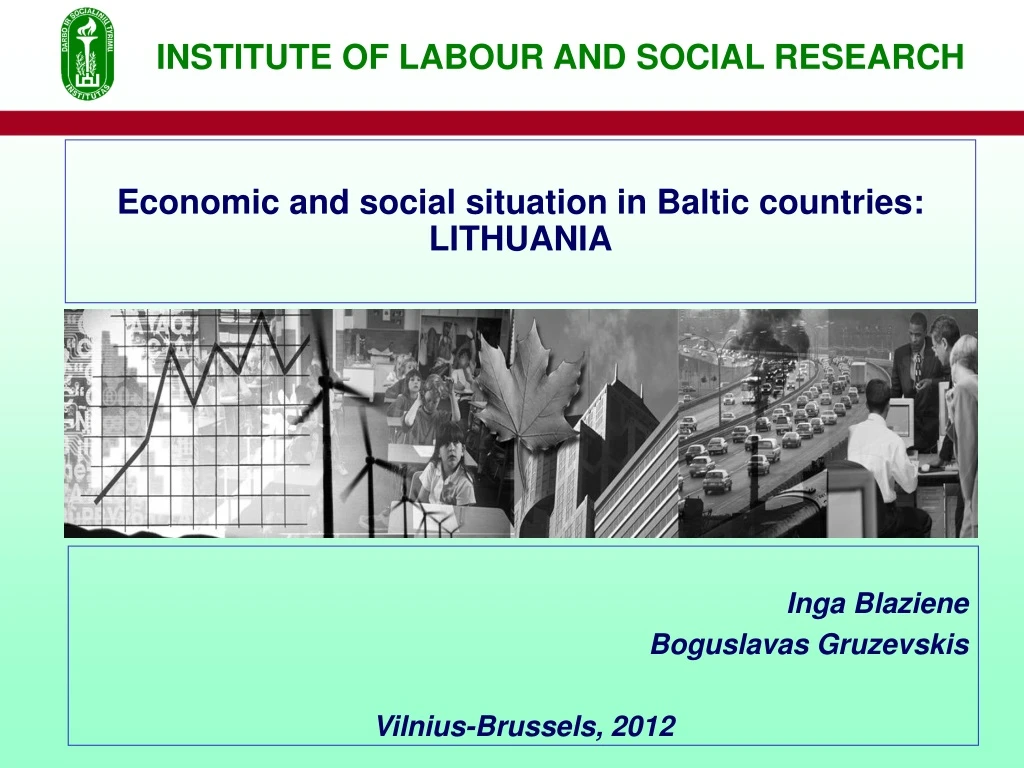
INSTITUTE OF LABOUR AND SOCIAL RESEARCH Economicand social situation in Baltic countries: LITHUANIA Inga Blaziene Boguslavas Gruzevskis Vilnius-Brussels, 2012
CONTENT • Evaluation of Lithuanian economic potential (GDP); • Unemployment developments; • Population income and living standards; • Emigration and demographic perspectives in Lithuania; • Conclusions.
Treaty on European Union • The Union […] shall work for the sustainabledevelopment of Europe based on balanced economic growth and price stability, a highly competitive socialmarket economy, aiming at full employment and social progress […]. • It shall combat social exclusion and discrimination, and shall promote social justice and protection […]. • It shall promote economic, social and territorial cohesion, and solidarity among Member States. • (Treaty on European Union, Title 1, Article 3)
Unemployment rate in EU in 2011 (%) Source: „Eurostat“
Youth unemployment rate in EU in 2011 (%) Source: „Eurostat“
Average annual gross earnings in business economy in EU in 2009-2010 (euro)
Average annual gross earnings in business economy in EU in2006-2007(euro)
Average gross monthly wages and salaries in Lithuania in 2001-2011
Average monthly income in Lithuania in the 1st quarter, 2012
Price level index of selected consumption goods and services in Lithuania and EU-27 in 2010 (%)
Austerity measures • increased VAT (from 19% to 21%); • decreasedold age pensions; • decreased unemployment social insurance benefits; • tighten conditions for payment of unemployment social insurance benefits; • decreased salaries of public sector employees(by 4-12%); • low minimum monthly wage was not increased, etc.
Unemployed and unemployed receiving unemployment benefits in Lithuania in 2008-2010
Recipients of social benefits in Lithuania in 2005-2011 (thous.)
Persons, emigrated from Lithuania: 2004–2011 – 330 thous. 1990–2011 – 668 thous.
Acceleration of demographic ageing in some EU countries in 2006-2011 m. (%)
Lithuanian population by gender and age in 2010 and forecasts for 2060 • Men, 2010 • Women, 2010 • 20601 in 2060 – 2 million 548 thous. (by 697 thous. less comparing to 2011) 1 1
Lithuanian perspectives in 2060 Lithuania: will have2,5 millionresidents, out of them youth (15-29 years) – 339,6 thous.(13%)
Social insurance statistics in Lithuania in 2006-2011 At the end of 2012 m. State social insurance fund debt will reachLTL 12 billion (3,5 billioneuro).
low labour productivity and low wages; Causes of such a situation include: • low living standards and “poverty trap”, high rate of economic inactivity; • decrease in number of enterprises (especially – large, small and medium) and low technological level of production; • imbalances in vocational education and training and structural unemployment (in 2011 as much as 11% of large enterprises declared shortage of qualified labour force); • unattractiveness of the national labour market comparing to the EU one.
the fastest depopulation in the EU; Conclusions • the fastest ageing society in the EU; • decreasing economic capacity/potential of the country (number of enterprises and economic activity of the population); • increasing poverty; • inefficient social security policy; • huge distrust in public authorities (especially – the Parliament and the Government).