Download
1 / 15
150 likes | 175 Vues
Explore the use of hierarchical clustering in identifying gene signature groups for Diffuse Large B-cell Lymphoma, a common subtype of non-Hodgkin’s Lymphoma, to uncover potential drug targets and guide treatment strategies.

E N D
Alizadeh et. al. (2000) Stephen Ayers 12/2/01
Clustering “Clustering is finding a natural grouping in a set of data, so that samples within a cluster will be more similar to each other than they are to samples in other clusters.” Finding groups of correlated genes “signature groups” Genes without well established relationships Extract features of groups
Hierarchical Clustering • Tiers of points from a bottom layer of 1 point in each of n clusters to top level of n points, all in one cluster • Usually represented in dendrogram
Divisive • Top-down • Start with all samples and successively split into separate clusters
Agglomerative • Bottom-up approach • Less computationally intensive • Start with n singletons and successively merge clusters • Place all values in separate clusters • Merge most similar clusters into higher clusters • Repeat until all clusters have been merged
Average-Linkage Method • Available <<http://rana.stanford.edu/clustering >> • Compute similarity matrix • Scan matrix to find most highest similarity • Uses form of the correlation coefficient • A node is created between these values • Values are replaced by node
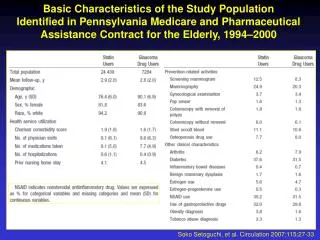
Diffuse Large B-cell Lymphoma • Most common subtype of non-Hodgkin’s Lymphoma • 25,000 cases/year • 40% of patients respond well • Possible undetected heterogeneity • Found 2 classes using clustering (Eisen 1998): Germinal Center B-like and Activated B-like
Lymphochip • 17,856 cDNA clones total • 12,069 germinal center B-cell library • 2,338 lymphomic cancer genes • 3,186 genes important to lymphocyte or cancer biology • ¼ of genes = duplicates
Expression Analysis • DLBCL, Follicular Lymphoma, Chronic Lympohcytic Leukemia • Lymphocyte subpopulations with a range of conditions • -normal human tonsils, lymph nodes • -lymphoma, leukemia cell lines
Figure 4: GC Activated
Conclusions • More categories likely • Changes in treatment • Possible drug targets