Innovative Asset Allocation and Product Selection Strategies for High Net Worth Investors
480 likes | 628 Vues
Join Travis Morien of Compass Planners Pty Ltd for insights into asset allocation and product selection tailored for high net worth investors. This session, at the Tribeca Conference on October 25th-26th, 2004, explores the benefits of both active and passive investing, emphasizing the importance of a diversified approach. Learn how to identify effective managers and construct a balanced portfolio while considering tax efficiency and market conditions. Discover the key trends in investment management to optimize returns.

Innovative Asset Allocation and Product Selection Strategies for High Net Worth Investors
E N D
Presentation Transcript
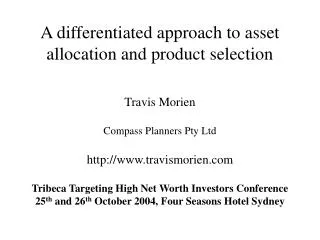
A differentiated approach to asset allocation and product selection Travis Morien Compass Planners Pty Ltd http://www.travismorien.com Tribeca Targeting High Net Worth Investors Conference 25th and 26th October 2004, Four Seasons Hotel Sydney
Active vs. passive investing Pictures by Vanguard Investments
“Properly measured, the average actively managed dollar must under-perform the average passively managed dollar, net of costs” (Bill Sharpe) Distribution of Manager Returns vs. Benchmark Pre-fees: Post-fees: Good Managers -4% +4% -5% +3% Average = -1% Average = 0% Source: “Arithmetic of Active Management”, Financial Analyst Journal, Jan 91.
Number of Australian Share managers outperforming the S&PASX300 Index, post fees (12 months to 31 July) and value minus growth returns Value outperforms Growth outperforms Top chart source: Mercer/Morningstar IDPS Survey Bottom chart source: Dimensional Fund Advisors
Every US large cap fund with a 15 year history vs the S&P500 and CRSP 1-10 indexes. 15 Years ending 31 December 2001 (285 Funds) Graphic by Dimensional Fund Advisors
Survivorship bias: amount median prices are overstated per year Source: Russel Investment Group, periods ending 30 June 2004, “Insights” IN107.
"Investors continue to sour on stocks. So far this year, investors have made net withdrawals of $11.3 billion from their stock mutual funds according—including a hefty $3.7 billion just last week—according to AMG Data Services.” Source: Gregory Zuckerman, "Investors Rush to Buy Bonds, Fleeing Stocks," Wall Street Journal, March 11, 2003 S&P500 data source: http://finance.yahoo.com
Annual returns of “buy and hold” index vs actual annual returns enjoyed by US mutual fund investors from 1984 to 2002 Source: DALBAR, Inc. Media release of 2003 update of “Quantitative Analysis of Investor Behaviour” study.
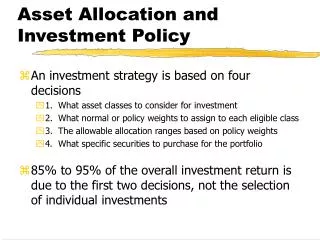
The diverse world of passive investing • Traditional index funds (BGI, Vanguard) • Enhanced index funds (BGI, Macquarie) • Exchange traded funds (Streettracks) • “Style indexed” funds (Vanguard ASHY) • Asset class funds (Dimensional)
Fama and French’s Three Factor Model Graphic by Dimensional Fund Advisors
Fama/French indexes on the US market Annualised returns July 1926 – August 2004 Figures do not include fees, taxes or other costs and past performance may not be indicative of future results. Source: Dimensional Fund Advisors
Global value 17.75%pa Global small 16.06%pa Global large 13.78%pa Figures do not include fees, taxes or other costs and past performance may not be indicative of future results. Source: Dimensional Fund Advisors
Australian value 19.97%pa Australian large 13.02%pa Australian small 12.06%pa Figures do not include fees, taxes or other costs and past performance may not be indicative of future results. Source: Dimensional Fund Advisors
Adding emerging markets to an international shares portfolio MSCI World Index + MSCI Emerging Markets Free Index, January 1988 to September 2004 Percentage emerging markets
What do we want from active funds? • Active funds potentially can have higher performance • Passive funds are not available for all asset classes • Perhaps something very different to the index for diversification
Cash Australian Shares Fixed Interest Property International Shares Active “Satellite” Index Core Core/Satellite Approach Sector Index Funds: • Tailor strategic allocation • Increase index core where confidence in active is low Graphic by Vanguard Investments
The cost of active management from a low tracking error manager 80% x 0.286%pa + 20% x 6.356%pa = 1.5%pa Wholesale index MER + aggressive fund MER = low tracking error MER
“The whole concept of dividing it up into "value" and "growth" strikes me as twaddle. It's convenient for a bunch of pension fund consultants to get fees prattling about and a way for one advisor to distinguish himself from another. But, to me, all intelligent investing is value investing.” Charlie Munger
Value Perpetual, MBA, Dimensional Growth Colonial FS, Credit Suisse Relative Value Lazard GARP BT, ING Neutral UBS Indexed Vanguard The Style Universe Growth Value Graphic by Vanguard Investments
Tax efficiency • Income/growth and franking credits • Turnover • Tax loss selling • Hold range • Short vs. long term CG realisations • Tax liability on existing portfolio • Consider your turnover as well, how often will you switch an active manager compared to a passive one. Vanguard is now reporting after tax returns, Morningstar will start tracking them from next year.
Capacity issues • Market size (large cap vs. small, domestic vs. international) • Portfolio turnover • Contrarian vs. momentum • Active positions/index weightings (tracking error) • Large size offset by possible new opportunities and market clout.
Why does turnover matter? • Ruins tax efficiency • Increases brokerage and market impact costs, making it increasingly difficult to outperform as the portfolio gets larger. • According to a US researcher, the Plexus Group, managed funds incur costs of around 0.8% on each side of a transaction. It costs about 1.6% round trip to buy and sell a stock.
Key person risk • Skill vs. process • Incentive structure • Institution vs. boutique • Staff equity ownership • Eating their own cooking
Suggestion for picking active funds • Avoid “index huggers” that charge a full active MER. Funds with concentrated high conviction portfolios may actually represent better value on a price per active position basis. • Avoid tax inefficient funds for investors on high tax rates. The tax inefficiency penalty can cost several percentage points per year. If you must use inefficient funds, use super. • Avoid “growth at an unreasonable price” funds and funds with excessive turnover. Seek out funds with a value philosophy, but not necessarily funds pigeonholed into a “value” classification. • Look for fund managers with a performance culture rather than a FUM gathering culture that adequately reward their key staff.
"The essence of risk management lies in maximising the areas where we have some control over the outcome while minimising the areas where we have absolutely no control over the outcome and the linkage between effect and cause is hidden from us." Peter Bernstein Bernstein, P. L. Against the Gods: The Remarkable Story of Risk. Wiley; New Ed edition (1998)
“The determining question in structuring a portfolio is the consequence of loss; this is far more important than the chance of loss." Peter Bernstein Bernstein, P. L. Management of Individual Portfolios. The Financial Analysts Handbook; Levine, S. Ed.; Dow Jones Irwin Inc: Homewood Il, 1975.
Risk is the probability of not having sufficient cash with which to buy something important. • Risk is a function of a portfolio's assets and its liabilities, in particular the cash flow between the two over time.
Dividends vs. interest, ASX200 index vs. treasury bills Source: Reserve Bank of Australia
Income planning for pensions • Dividends are fairly reliable for diversified portfolios • We can’t eliminate capital volatility but we can make it less relevant through portfolio structuring. • Fund near term capital withdrawals with cash, if you aren’t drawing down on shares then share market volatility is sidestepped. • This turns asset allocation into a mere budgeting exercise! Put aside enough cash to cover the dividend shortfalls and you’ll reduce your need to sell shares.
Three dimensions of risk profiling • Tolerance of loss • Timing of cash flows (time frame) • Tolerance of tracking error, unconventionality and complexity
20% Australian large 20% Australian value 10% Australian small 20% global large 20% global value 10% global small 50% Australian large 50% global large Source: Dimensional Fund Advisors
Portfolio drawdown (maximum loss) Source: Dimensional Fund Advisors
Disclaimer: This article contains the opinions of the author but not necessarily the author’s employer or any of the individuals or companies mentioned in this presentation, and do not represent a personal recommendation of any particular security, strategy or investment product. The author's opinions are subject to change without notice. Information contained herein has been obtained from sources believed to be reliable, but is not guaranteed.