Pure Substances
Pure Substances. Thermodynamics Professor Lee Carkner Lecture 5. PAL # 4 First Law. Pumping water uphill and then running it back to produce energy Rate of power imparted to water = W’ water = (1000)(2)(9.8)(40) = But the pump and the turbine are only 75% efficient

Pure Substances
E N D
Presentation Transcript
Pure Substances Thermodynamics Professor Lee Carkner Lecture 5
PAL # 4 First Law • Pumping water uphill and then running it back to produce energy • Rate of power imparted to water = • W’water = (1000)(2)(9.8)(40) = • But the pump and the turbine are only 75% efficient • hpump = W’water/W’pump • W’pump = 785/0.75 = • Cost per year = (1046)(10)(0.03)(365) = $114500 • hturbine = W’turbine/W’water • W’turbine = (785)(0.75) = • Revenue per year = (785)(10)(0.08)(365) = $171900 • Net Yearly Profit =
PAL # 4 First Law • Should you build it? • No
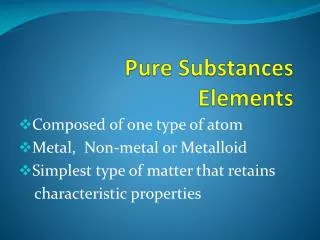
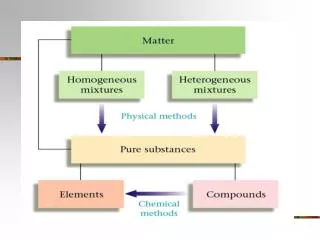
Pure Substances • A pure substance consists of either a single type of atom or molecule or a homogeneous mixture • Can exist as a mixture of phases • Gas • Liquid • Solid • Strong intermolecular forces, high density, fixed molecular position
Types of Phases • Compressed liquid • Saturated liquid • Saturated Vapor • Saturated liquid and vapor can coexist together • Superheated vapor
Saturation • A substance changes phase when it is at the saturation temperature for a given pressure • Can be compiled in tables for reference • Tsat increases with Psat • Need more internal energy to become vapor at higher pressure
Enthalpy • Defined as: h = u + Pv H = U +PV • Very useful for flow systems such as turbines
Specific Volume and Quality • Mass of saturated liquid = mf • Mass of saturated vapor = mg • Since both phases often co-exist we define the quality, x: • The quality is the relative fraction of the mixture in the vapor phase
Quality Relations • The total volume of a mixture is: • the volume occupied by each phase is: • We can use these relationships to write an expression for the combined specific volume of the mixture: vavg = vf +xvfg x = (vavg –vf )/vfg
Property Diagrams • We will plot three key variables P, T, and v as: • Each region of the diagram represents a phase or mixture of phases
Pv Diagram Properties • Saturation curves define boundaries of liquid-vapor mixture region • Critical point is on the critical isotherm • Densities of both are the same • Above the critical point, no amount of pressure can condense the vapor to a liquid
PT Diagram • Three curves can be drawn on the PT diagram • Fusion curve • Vaporization curve • Sublimation curve • The curves bound three distinct regions, one for each phase • Juncture of the three curves is the triple point where all three coexist
Other PT Features • An isobar at standard atmospheric pressure intersects the normal boiling and melting points • The critical point is on the vaporization curve • Gas above critical T is called “gas”, below it is called “vapor”
PVT Diagram • P, V and T relations can be formed to create a three dimensional diagram • The PT and PV diagrams are formed by projection
Next Time • Read: 3.6-3.8 • Homework: Ch 3, P: 48, 54, 75, 86