Scope
Evolutionary Feature Extraction for SAR Air to Ground Moving Target Recognition – a Statistical Approach Theory of Statistical Measures Dr. Janusz Starzyk Ohio University. Scope. Signal Characterization Clustering Baseline Approach Principal Component Analysis Hybrid Distance

Scope
E N D
Presentation Transcript
Evolutionary Feature Extraction for SAR Air to Ground Moving Target Recognition – a Statistical ApproachTheory of Statistical MeasuresDr. Janusz StarzykOhio University
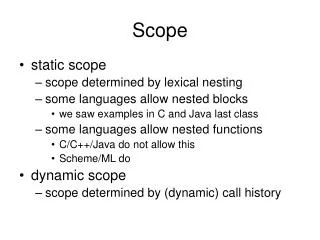
Scope • Signal Characterization • Clustering • Baseline Approach • Principal Component Analysis • Hybrid Distance • Piecewise Linear Approach • Test Results • Conclusion
Data Description • MSTAR program data collections 1 & 2, scene 1 • 1-D High Range Resolution (HRR) data • 10 target classes • Two target classes (BMP2 and T72) have variants • The HRR data extracted from X-band 1x1 foot resolution SAR images • data collected at 15o were used for testing and 17o for training
2S1 BRDM2 SAR Images
2S1 BRDM2 Images of the Experiment Targets BMP2-c21 BTR60 BTR70-c71
Clustering for Classification of HRR Signals • Why to use clustering in classification • What are the shortcomings of the traditional clustering • Our program • Test results
Popular Clustering Methods • Parametric approach • k-means approach • Normal Decomposition • Nonparametric approach • valley-seeking
Shortcomings of the Clustering Methods • Parametric approaches • pre-assuming number of clusters • Non-Parametric approaches • sensitive to the control parameters used in the algorithm • dependent on the distribution of data • not able to accurately approximate the overlapped distributions
Data Clustering Algorithm • Extraction of the seed clusters • Coverage of the training data signals by the seed clusters • Size of the seed cluster • Merging of the clusters with a similar distribution
Statistical Concepts in Clustering • MD - Minimum Distance • AMD - Average Minimum Distance • X - the mean value of AMD • Z - the lower bound of AMD • Y - the upper bound of MD
Threshold Selection for the Cluster Growth Program • Design of the statistical experiment 1. Generate uniformly distributed data 2. Calculate the minimum distance for every point 3. Draw the distribution of the MD and AMD
Definition of Threshold Where MminD is the mean of the minimum distances in the current cluster. and Ratio =Y/Z=spread of the minimum distance/minimum AMD
The Cluster Merging Algorithm • Focus - how to identify the clusters whose distributions are consistent? • Generate two groups of uniformly distributed points with different sizes and mean values • Calculate the NOA between two groups • Change R_size and Distance and repeat the above experiment. • The NOA rule
The Touch Point of Two Clusters The parameters affecting the NOA • Distance - the distance between the means of two clusters • R_size - the ratio of two clusters’ sizes
Merging Program • Using the threshold to decide whether to merge the clusters in the same class • Using the NOA value to the nearest cluster from a different class to terminate the selection for the current cluster
Baseline Approach • 1 foot range resolution with 1.5x oversample • Full aspect training and testing • Training on MSTAR targets at 17o depression angle (1365 profiles total) • Testing on MSTAR targets at 15o depression angle (1134 profiles total) • Baseline algorithm (+/- 5 degrees template aspect gate) with 1-look • Leaving-One-Out Method (LOOM) applied to supplement unknown targets
Alignment in theBaseline Program To minimize ErrorB solve which gives
Alignment Result 1.4 Template Observation 1.2 Absolute difference Aligned difference 1 0.8 0.6 0.4 0.2 0 -0.2 -0.4 -0.6 0 10 20 30 40 50 60 70
6 5 4 3 2 1 0 0 50 100 150 200 250 300 350 400 MSE for different targetsw.r.t template of target 2s1_b01 MSE-> Azimuth->
Decision Threshold • Rejection threshold computed for each target and pose from MSE for testing targets against templates • tjp = meanjp + factor * stdj • j is the target and p is the pose index • meanis computed using 5 point moving average • std is computed over all pose angles
Prej = 1.2% Pdec = 98.8% Pid = 78% Pmis-id = 20.8% Pfa = 82% Baseline Classification Result(Factor =2)
Principal Component Analysis Template is defined using and has singular values n is the number of template signals m is the number of features The covariance
Distance Measures Consider an observation point and define • Euclidean Distance • Mahalanobis distance
Comparison between MD and ED In the original space In the projected space
MD confusion table(3.5 degrees data) Pdec = 96.4% Pid = 37.2% Pmis-id = 59.2% Pfa = 93%
Definitions of Hybrid Distance HD • Euclidean Distance • Mahalanobis distance • Hybrid distance Cmtrx should combine the characters of the ED and MD
Definitions of HD • HD1 • HD2
Definitions of HD • HD3 • HD4
15 15 10 10 5 5 0 0 -5 -5 -10 -10 -15 -15 -15 -10 -5 0 5 10 15 20 25 -20 -15 -10 -5 0 5 10 15 20 15 10 5 0 -5 -10 -15 -15 -10 -5 0 5 10 15 20 25 Synthetic Examples
Hybrid Distance Clusters Signal values Azimuth
Classification Results for HRR Trumpet Data (HD & Baseline) Template: several chips within 10 degree Observation: 5-points averaged chip data
Classification Results for HRR Trumpet Data (HD & Baseline) Template: a chip data; Observation: 5-points averaged chip data
ROC Curves for HRR Trumpet Data (HD & Baseline T10-5a) 1 0.9 0.8 0.7 Baseline Result Hd1 Result Probability of False Alarm Probability of Correct Classification given Declaration Hd2 Result 0.6 Hd4 Result 0.5 0.4 0.3 0.55 0.6 0.65 0.7 0.75 0.8 0.85 0.9 0.95 1 Probability of Declaration