Download

1 / 15
150 likes | 155 Vues
Large-scale influences during ACTIVE – Rossby waves and their effects on tropical convection. Grant Allen 1 G. Vaughan 1 P. May 2 D. Brunner 3 , W. Heyes 1 , P. Minnis 4 (grant.allen@manchester.ac.uk). 1 Centre for Atmospheric Science, University of Manchester

E N D
Large-scale influences during ACTIVE – Rossby waves and their effects on tropical convection Grant Allen1 G. Vaughan1 P. May2 D. Brunner3, W. Heyes1, P. Minnis4 (grant.allen@manchester.ac.uk) 1Centre for Atmospheric Science, University of Manchester 2Bureau of Meteorology, Melbourne, Australia 3EMPA, Switzerland 4LARC, NASA Final ACTIVE meeting – Manchester, 21st May 2009
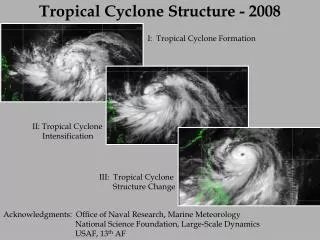
Scope • What are tropical tropopause folds? • Why are they important? • A case study of a series of folds during the ACTIVE campaign • Implications for tropical convection
Isentropic descent – Tropopause folds Plot taken from Holton, 1995 Isentropes =solid lines Isotherms = dashed lines Shaded area = lowermost stratosphere • The thermodynamic structure of the tropical troposphere links the sub-tropical lower stratosphere with the tropical troposphere – no barrier to transport (isentropic) • One mechanism of such transport is due to breaking Rossby waves and consequent tropopause folding along the STJ
A Region of Interest (ROI) Left: MTSAT WV image – dark areas are dry, blue represent tall/high clouds) NW Australia Domain defined for analysis: Lat: 20 12 OS Lon:120-135 OE • Region of interest (cross-hatch area above) defined here for further analysis • Region defined by the prevalence of an eastward-advancing dry slot (dark area in MTSAT WV image above)
Convective (and other) properties of the ROI • Two “tropical drought” periods are defined by grey shaded time periods. • Time-series of cloud fraction shows anti-correlation with PV during periods of large-scale descent (ω) • Rainfall and mid-level RH are also correlated during the dry periods • Together, these trends show that rainfall and cloudiness were much reduced during the passage of a series of tropopause folds (evident as periods of high PV) • Concentrate here on the second drought period as a case study
Cloud Cover and Height • Derived from MTSAT-1R brightness temperatures using a split-window technique of Minnis et al., 1995 • During the drought period, convection is shallow and limited to the coast (where forcing is likely to be strongest)
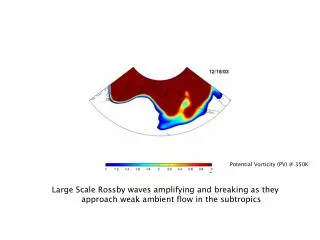
Rossby waves Arrows= wind direction scaled to speed Colours= Potential vorticity Selected images of ECMWF PV (at 325 K) and wind data show the passage of a series of breaking Rossby waves (red protrusions) over northern Australia during the dry period The double breaking event on 22 Nov (panel b) facilitated the northward propagation of the wave by 23 Nov (panel c). By 27 Nov, a quiescent jet was re-established to the south
Tropopause folds • A finger of high PV defines the fold, which enters the ROI on 22 Nov carrying very dry air from the tropopause • The PV signature associated with the fold persists until ~ 25 Nov • The dry air advected by the fold persists in the ROI even after the PV signature is lost on 27 Nov Colours = PV Black contours = RH % Dashed lines = Equivalent potential temperature Vertical dashed lines define the latitude limits of the ROI
Ozone and humidity profiles Deep dry, ozone-rich layers present between 22nd – 27th Nov 13th and 30th Nov are typical pre-monsoon examples Spot the odd one out – transition between the influence of the two separate folds
Back trajectories • 4-day cluster back trajectories from the enhanced ozone layers observed at Darwin show they originated in or near to the breaking Rossby waves • By 30 Nov (panel e), after the drought period, trajectories return to a more climatological tropospheric origin.
Left: Plots of CAPE and CIN diagnosed from ECMWF profiles at 0930 local time on 20 Nov 2005 over N Australia • The tropical cloud band developed in a region of high CAPE (> 2000 J/kg), but low CIN (< 100 J/kg) • The region of low CAPE and high CIN to the SW of the line indicates the position of the advancing dry slot seen in the satellite images
Dynamics at the point of convective initiation • A cross-section of wet-bulb potential temperature (Theta-W above) through the plume shows a region of reduced theta-W above the boundary layer at 14O S (where convection originated) • This reduction of theta-w with height over a moist boundary layer represents a region of high potential instability
Conclusions • A series of breaking Rossby waves over northern Australia during November 2005 led to strong modulation of convection over a wide area of the tropics • Dry air which descended due to tropopause folding led to a marked reduction in cloud-cover and rainfall for a period of 6 days in total • At the edge of one such advancing dry layer, generation of potential instability led to an eruption of a synoptic scale cloud system. • Further evidence that mid-latitude tropopause level processes can influence tropical convection and rainfall.