Download
1 / 8
80 likes | 238 Vues
The Belfast Youth Development Study: A longitudinal study of adolescence. The Sample. Wave 7 2,087. Wave 6 2,335. Wave 5 3,830. Wave 4 3,965. Wave 1 3,834. Wave 2 4,343. Wave 3 4,522. 2010/2011. 2006/2007. 2003. 2004. 2005. 2002. 2001. School year: Age: . Y 8 11/12.

E N D
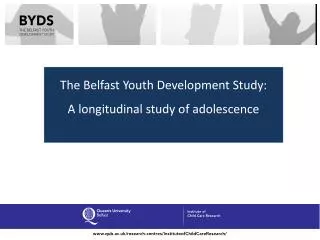
The Belfast Youth Development Study: A longitudinal study of adolescence
The Sample Wave 7 2,087 Wave 6 2,335 Wave 5 3,830 Wave 4 3,965 Wave 1 3,834 Wave 2 4,343 Wave 3 4,522 2010/2011 2006/2007 2003 2004 2005 2002 2001 School year: Age: Y 8 11/12 Y 10 13/14 Y 9 12/13 Y 12 14/15 Y 11 14/15 20/21 16/17
The Questionnaire Adolescent drug use e.g. School friends Peers, School and Neighbourhood e.g. Alcohol intoxication e.g. Educational aspirations e.g. Problem drug use e.g. Neighbour- hood control The questionnaire e.g. Mental health e.g. Parental attachment Family Personal characteristics e.g. Personality traits e.g. Parental monitoring
School-Related Predictors of Drug Use (Perra et al. 2012; J. of Adolescence) • Weekly Cannabis Use (age 15): Adjusted Odds Ratios *p < .05; **p < .01
Alcohol and the affluence paradox • AUDIT scores (age 15) by adolescent drinking trajectory (age 12-15) and SES
Path Analyses Path Analyses-Sweep 5 (n=308) Fathers Alcohol Use .06 Child alcohol use (15 yrs) .45** .19** -.26** Mothers Alcohol Use Mothers Monitoring -.24** Fig. 1 Path model showing the hypothesised relations between the observed variables Path coefficients reported ** p<0.01, *p<0.05
Path Analyses Path Analyses-Sweep 7 (n=181) Fathers Alcohol Use .17* Child alcohol use (21 yrs) .48** .10 -.04 Mothers Alcohol Use Mothers Monitoring -.18* Fig. 2 Path model showing the hypothesised relations between the observed variables Path coefficients reported ** p<0.01, *p<0.05
The BYDS team: • Dr Oliver Perra • Dr Mark McCann • Claire McCartan • Dr Aisling McLaughlin • John Moriarty • Dr Kathryn Higgins (Deputy Director ICCR)