Download
1 / 22
230 likes | 319 Vues
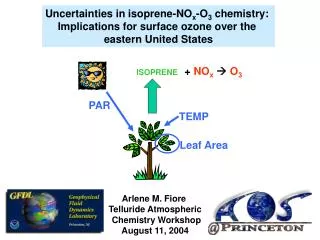
Uncertainties in isoprene-NO x -O 3 chemistry: Implications for surface ozone over the eastern United States. + NO x ïƒ O 3. ISOPRENE. PAR. TEMP. Leaf Area. Arlene M. Fiore Telluride Atmospheric Chemistry Workshop August 11, 2004. Sweetgum Invasion of Pine plantations.

E N D
Uncertainties in isoprene-NOx-O3 chemistry: Implications for surface ozone over the eastern United States + NOx O3 ISOPRENE PAR TEMP Leaf Area Arlene M. Fiore Telluride Atmospheric Chemistry Workshop August 11, 2004
Sweetgum Invasion of Pine plantations -20 –10 0 +10 +20 +30 Percent Change mid-1980s to mid-1990s • based upon analysis of > 280,000 forest plots • substantial isoprene increases in southeastern USA • largely driven by human land-use decisions Recent Changes in Biogenic VOC Emissions [Purves et al., Global Change Biology, 2004] Isoprene Monoterpenes Trends in anthropogenic precursors?
-20 –10 0 +10 +20 +30 Percent Change from US EPA national emissions inventory database(http://www.epa.gov/air/data/neidb.html) Trends in Anthropogenic Emissions: 1985 to 1995 CO VOC NOx • Large decreases in CO and VOC Emissions • Some local increases in NOx • Higher biogenic VOCs Net effect On O3?
Tool: GEOS-CHEM tropospheric chemistry model [Bey et al., 2001] • Uses assimilated meteorology: GEOS-3 1°x1° fields for 2001 • 48 vertical levels ( 9 below 2 km) • Regridded to 4°x5° for global spinup and boundary conditions for nested 1°x1° resolution over North America [Wang et al., 2004; Li et al., 2004] • 31 tracers; NOx-CO-hydrocarbon-O3 chemistry coupled to aerosols • GEIA isoprene inventory [Guenther et al., 1995] • v. 5-07-08 (http://www-as.harvard.edu/chemistry/trop/geos/index.html) July 2001 1-5 p.m. Surface O3 (ppbv)
Model Evaluation: July 2001 1-5 p.m. Surface O3 (ppbv) Mean Bias = 6±7 ppbv r2 = 0.4
-20 –10 0 +10 +20 +30 (%) Isoprene increases reduce O3 in Southeastern US Standard GEOS-CHEM 1x1 N. American Nested simulation: July 1-5 p.m. O3 Change in July 1-5 p.m. surface O3 (ppbv) + Isoprene emission changes from mid-80s to mid-90s [Purves et al., 2004] Low-NOx regime? e.g. titration of OH in pre-industrial [Mickley et al., 2001] & tropical [von Kuhlmann et al., 2004] boundary layers
IncreasingIsoprene Decreases Ozone in “Low-NOx” environment GEOS-CHEM base-case July 1-5 p.m. mean NOx- saturated Ozone NOx- sensitive Low-NOx High-NOx “isoprene-saturated”?? NOx VOC SE US is near “maximum VOC capacity point”, beyond which VOCs suppress O3 formation; [Kang et al., 2003]. “Isoprene-saturated” GEIA simulation: biogenics+O3 (10d) comparable to O3+HOx (16d), hn -> OH (11d) in SE US (31-37N; 81-91W) ISOP
Isoprene can decrease surface O3 by: • Sequestering NOx as organic isoprene nitrates • Titrating OH and enabling direct reaction of isoprene with O3 High-NOx NO2 O3 NO (very fast) Isoprene nitrates RO2 OH HO2 Isoprene ROOH OH O3 O3 (slower ) Low-NOx, high-isoprene Uncertainties in the fate of organic nitrates and peroxides: Sinks of HOx / NOx vs. recycling of radicals?
Impact on surface O3 from uncertainties in chemical fate of organic isoprene nitrates & peroxides Change in July mean 1-5 p.m. surface O3 (MOZART-2) When isoprene nitrates act as a NOx sink When organic peroxides act as a HOx sink
Anthrop. NOx emissions 0.47 TgN (1011 molec cm-2 s-1) Difference in July 1-5 p.m. surface O3 (Purves–GEIA) (ppbv) Choice of isoprene emissions critical for predicting surface O3 GEIA: global inventory 5.8 TgC Purves et al., [2004] (based on FIA data; similar to BEIS-2) 3.0 TgC GEIA (1011 molecules isoprene cm-2 s-1)
Surface Ozone Response to isoprene and anthropogenic NOx emissions: sensitive to isoprene inventory choice Change in July O3 (ppbv; 1-5 p.m.) Isoprene reduced 25% NOx reduced 25% July Anthropogenic NOx Emissions With GEIA ° (1011 molec cm-2 s-1) With Purves Low-NOx, high isop: O3 as isop High-NOx: O3 as isop
PAN most influenced by isoprene in high-NOx locations Change from -25% isoprene emissions Change from -25% anthrop. NOx emissions Mean July at surface With GEIA (ppbv) (ppbv) (ppbv) With Purves (ppbv) (ppbv) (ppbv) Little effect on PAN in SE US where isoprene changed most
Change in Mean July Surface O3 (ppbv; 1-5 p.m.) reflecting 1980s to 1990s emissions changes With Anthrop. Changes With Anthro.+ BVOC Changes With BVOC Changes With GEIA Isoprene Emis With Purves et al. Isoprene Emis Changes in Anthropogenic NOx emissions dominate O3 response But response depends upon choice of isoprene emission inventory Comparison with observed changes? Impact on high-O3 events?
Model vs. Obs.: Change in July O3 1980s to 1990s (ppbv; 1-5 p.m.) Obs: EPA AIRS GEOS-CHEM: GEIA GEOS-CHEM: Purves (1993-1997) – (1983-1987) Poor correlation (r2 ~ 0) between observed and simulated changes Observed changes in O3 are not explained by emission changes alone…
GEIA Purves Northeast Southeast Impact of Sensitivity Simulations on High-O3 Events: • decrease with isoprene except for GEIA SE • decrease with NOx, larger response with GEIA • dominated by anthrop. (NOx) emissions changes from 1980s to 1990s but BVOC changes may offset (Purves case) decreases of most extreme events
Preliminary Conclusions&Remaining Challenges • Better constrained isoprene emissions are needed to predict O3 response to both anthrop. and biogenic emission changes • Utility of satellite CH2O columns? • New inventories (MEGAN, BEIS-3) more accurate? • NASA INTEX-NA observations?
GEIA BEIS2 7.1 Tg C 2.6 Tg C GOME MEGAN 5.7 Tg C 3.6 Tg C Isoprene emissions – July 1996 [1012 atom C cm-2 s-1] [from Paul Palmer]
Vertical slices through 34N: enhanced isoprene, CH2O, PAN at surface & upper trop for GEIA compared to Purves With PURVES Altitude With GEIA Longitude 0 0.1 .25 0.5 1. 5. .1 .2 .5 1. 3. 5. 0 0.1 .25 0.5 0.8 1.0 0. .05 0.1 0.2 0.5 2. Insights from NASA INTEX-NA flights over SE US?
Preliminary Conclusions&Remaining Challenges • Better constrained isoprene emissions are needed to predict O3 response to both anthrop. and biogenic emission changes • Utility of satellite CH2O columns? • New inventories (MEGAN, BEIS-3, GLOBEIS) more accurate? • NASA INTEX-NA observations? • Recent isoprene increases may have reduced surface O3 in the SE • Does this regime actually exist? Can chemical indicators help? • Fate of organic nitrates produced during isoprene oxidation?
Chemical indicators for O3 or as Isoprene NO2 O3 High-NOx NO OH Isoprene nitrates RO2 Isoprene HO2 ROOH OH Change in O3 for 25% decrease in isoprene emissions HO2/NO H2O2/HNO3 Potential for using observations to diagnose isoprene-saturated regime, as for NOx-sensitive vs. NOx-saturated [e.g. Sillman, 1995]
Preliminary Conclusions&Remaining Challenges • Better constrained isoprene emissions are needed to predict O3 response to both anthrop. and biogenic emission changes • Utility of satellite CH2O columns? • New inventories (MEGAN, BEIS-3, GLOBEIS) more accurate? • NASA INTEX-NA observations? • Recent isoprene increases may have reduced surface O3 in the SE • Does this regime actually exist? Can chemical indicators help? • Fate of organic nitrates produced during isoprene oxidation? • Reported emission changes from 1980s to 1990s alone do not explain observed O3 trends • Role of decadal shifts in meteorology? • Are anthropogenic emissions inventories sufficient to support trend studies? (Parrish et al., JGR 2002: inconsistencies with CO:NOx ratios from road traffic in EPA inventories vs. ambient msmts)
Acknowledgments Larry Horowitz Chip Levy Drew Purves Steve Pacala Mat Evans Qinbin Li Bob Yantosca Yuxuan Wang