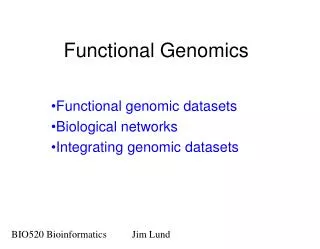
Caenorhabditis elegans Functional Genomics
Caenorhabditis elegans Functional Genomics. Sheldon McKay Januar y 22, 2004. Introduction C. elegans as a model organism Functional genomics Gene knockout project Goals Methods Progress Gene expression project Goals GFP-promoter fusions SAGE. C. elegans as a model organism.

Caenorhabditis elegans Functional Genomics
E N D
Presentation Transcript
Caenorhabditis elegans Functional Genomics Sheldon McKay January 22, 2004
Introduction • C. elegans as a model organism • Functional genomics Gene knockout project • Goals • Methods • Progress Gene expression project • Goals • GFP-promoter fusions • SAGE
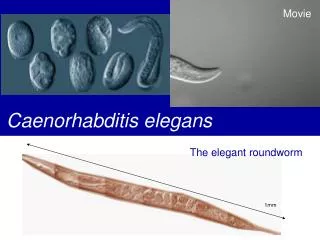
C. elegans as a model organism • A 1mm long nematode worm • Short generation time and large numbers of progeny. • A metazoan with differentiated tissues and comprehensively studied anatomy and developmental program • Sequenced genome
C. elegans genome • ‘Essentially complete’ as of December 1998 • Contains ~100 million bp on 6 chromosomes • Predicted to contain ~20, 000 genes. • ~ 55% of these genes are similar to genes from other organisms. • ~ 20% associated with mutationally defined genetic loci
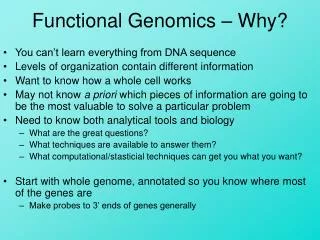
Genetics with a sequenced genome • Knowing the sequence isn’t everything. • We need to identify functions for as many uncharacterized genes as possible • Identification of a mutant phenotype in a gene of previously unknown function can help in assigning a function
Forward vs. Reverse Genetics • In classical genetic analysis, we start with a mutant phenotype, genetically map the gene(s) responsible to chromosomal locations then, hopefully, find the gene and study the DNA sequence • Reverse genetics: We start with a DNA sequence believed to encode a gene. We then attempt to learn about the gene’s function through expression analysis and perturbations of its normal function with tools such as RNAi and mutational analysis
C. elegans Functional Genomics Projects: Examples • Large-scale EST sequencing • ORFeome • Microarrays • RNAi • Gene Knockout Project
C. elegans Gene Knockout Project • Objectives: • Study gene function by • determining the null phenotype • Make knockouts for all genes, • with an emphasis on mammalian • orthologs • Approach: • Use PCR to detect, isolate and • sequence deletion alleles
Problems • The approach is biased towards large deletions • Sensitivity is low in complex populations • Targeting is imprecise
1o PCR 2o PCR NO PRODUCT The Poison Primer Technique
1o PCR 2o PCR The Poison Primer Technique
Deletions recovered with poison primers Exon Intron Normal Deleted Average deletion size: 486 bp
Precision knockout of a gene within a gene Exon Intron Normal Deleted
C. elegans Gene Expression Project Objectives: Build on the knockout project and other large-scale functional genomics projects Study gene expression patterns, with an emphasis on human orthologs
Approaches: • High resolution image analysis of gene expression with GFP/Promoter fusions • Serial Analysis of Gene Expression (SAGE) and microarray analysis of gene expression of life stages and cell types
Goals: Understand patterns of gene expression through the course of development and in particular cell types and tissues Identify known and novel cis-regulatory elements and their role in transcriptional regulation at the gene and network levels Understand gene expression patterns and protein interaction networks in the context of space and time in a developing organism
Green Fluorescence Protein Fusion Studies of Gene Expression
Isolating Potential Promoter Regions PCR primers Gene model SOCKEYE -- BCCA Genome Sciences Centre
PCR-based Promoter GFP fusion (Hobert, Biotechniques 32:728-30) Promoter GFP GFP Promoter
Neurons C13F10.4 -- contains similarity to Listeria monocytogenes Probable DNA-directed RNA polymerase delta subunit (RNAP deltasfactor).; SW:RPOE_LISMO
Neurons C13F10.4 -- contains similarity to Listeria monocytogenes Probable DNA-directed RNA polymerase delta subunit (RNAP deltasfactor).; SW:RPOE_LISMO
Neurons C13F10.4 -- contains similarity to Listeria monocytogenes Probable DNA-directed RNA polymerase delta subunit (RNAP deltasfactor).; SW:RPOE_LISMO protein of unknown function -- expressed in neurons
A case-study of tissue-specific upstream regulatory elements
M03F4.3 7-pass G-coupled transmembrane recepter Expressed in head, gut, vulva, tail Use PCR-stitching technique to dissect the putative promoter region
Tissue-specific Control Elements Vulva, Tail Head, Gut
SAGE • Objectives: • Determine temporal and spatial • gene expression patterns • Approaches: • Construct life-stage and tissue • specific SAGE libraries • Use GFP markers to isolate • tissue specific cell populations • via FACS
Isolate mRNA, RT to cDNA Digest with “Tagging enzyme” BsmFI Sequence Ligate tags SAGE: Procedure Digest with “Anchoring enzyme” NlaIII http://www.sagenet.org/home/Description.htm
SAGE Data Analysis • Tag abundance transcript abundance • Abundant tags = Abundant transcripts • Identify interesting tags, find out which genes they belong to
Statistical analysis of tag frequencies DISCOVERYspace -- BCCA Genome Sciences Centre
Mapping SAGE tags to genes NlaIII AAAAAAA
Mapping SAGE tags to genes Many predicted genes are not confirmed by Expressed Sequence Tags (ESTs) and do not include 3’ Untraslated regions (UTRs) 3’-most CATG Predicted: 5’ UTR 3’ UTR Actual: 3’-most CATG
Predicted Gene Models Genomic DNA Sequence EST Data No EST Data UTR length distribution Transcripts with EST support Estimate UTR length For unconfirmed gene models Transcripts without EST support Conceptual mRNAs
NlaIII 3’ 5’ AAAAAAAAAA 6 5 4 3 2 1 Real 3’ UTR Tags Estimated 3’ UTR Position of NlaIII site
NlaIII 2
Predicted Gene Models Genomic DNA Sequence Experimental SAGE tags EST Data No EST Data UTR length distribution Transcripts with EST support Map tags Transcripts without EST support Digest in silico Adjust 3’ UTRs Theoretical SAGE tags Adjust gene models Conceptual mRNAs
Relating Gene Expression to Development Source: http://nema.cap.ed.ac.uk/Caenorhabditis/C_elegans_genome
C. elegans Life Cycle Adult Embryo L4 L1 L3 L2 ~3.5 days
SAGE data: embryo Sage_summary -- BCCA Genome Sciences Centre
Developmental Series: Top 12 collagen genes Tags/100K egg larval adult old
Stress Response and Ageing Adult Embryo L4 L1 dauer L3 L2 ~3.5 days
daf-2 • Insulin-like growth factor receptor • Constitutive dauer formation at 25C; reversible by shift to 15C. • Increased lifespan at 20C; • Increased thermotolerance, UV resistance. • Most alleles hypersensitive to dauer pheromone.
Transcribed Telomeric Sequence(tts-1) • Most abundant trasncript in a SAGE comparison of dauer larvae and a normal mixed population (Jones, et al, 2001) • corresponds to a previously unknown non-coding gene • implicated in dauer larvae induction or maintenance
tts-1 expression patterns dauer longevity starvation 1-day adult 6-day adult 1-day adult 6-day adult 10-day adult Dauer larvae Mixed population Normal L1 larvae Starved L1 larvae daf-2