Download
1 / 24
240 likes | 358 Vues
Consumer Price Index CPI. Week 7 LSP 120 Joanna Deszcz. Prices. Name some prices that have changed in your lifetime Prices that have increased Prices that have decreased An Example Guess the Price open using Internet Explorer. Percentage Increase 1962-1998.

E N D
Consumer Price IndexCPI Week 7 LSP 120 Joanna Deszcz
Prices • Name some prices that have changed in your lifetime • Prices that have increased • Prices that have decreased • An Example • Guess the Price open using Internet Explorer
Percentage Increase 1962-1998 How does the quality of each item compare from 1962 to 1998?
What have we learned so far? • Prices can/do change dramatically in relatively short periods • Price from past can become virtually meaningless • Prices of items do not go up consistently • Some go up faster than others • Items change over time • Becomes difficult to compare prices because the items are not really comparable
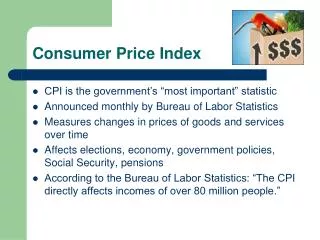
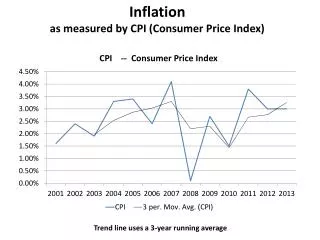
Inflation • The general increase of the price of goods over time • No obvious quality improvement • Okay as long a our income increases at same rate or higher • If not, not as well off as we think • Also important - financial planning • $100 today will not buy as much in 20 years
Some questions • How do we compare prices of today with those of the past? • How do we measure inflation?
Consumer Price Index • Way to compare prices in different years • Economists choose a “bundle” or “basket” of goods in varying proportions
CPI Continued • The cost of the bundle is assigned an index number • The following year the cost of the same bundle is determined • CPI for that year = new cost of bundle
Official CPI 1990-2010 Initial Index value = 100 and represents average CPI of 1982-84 • How to read the table • Used to compare prices of any two years • Example: same goods that cost $130.70 in 1990 would cost $172.20 in 2000 • So $130.70 in 1990 = $172.20 in 2000
Relationship Between Factors • Can calculate how many times more the prices of goods were in one year than another • Calculate the ratio of the CPI values • So, goods in 2000 cost 1.302 times more than in 1990 (on average) 2000 CPI = 170.2 = 1.302 1990 CPI 130.7
Converting to Constant Dollars • Comparing amounts from 2 different years • Can convert any money related variables • Prices, wages, salaries • Current prices for each year are called nominal • Compare prices taking changing value of money into account • Convert one price to same year as other • Usually convert forward to more recent year
Example • The price of gasoline in 1990 was $1.16 per gallon on average. In 1997, it averaged $1.22. Was gasoline more expensive or less expensive in 1997? • 1990 $130.70 equivalent to $160.50 in 1997 • 1997 CPI = 160.5 = 1.231990 CPI 130.7 • So $1.00 in 1990 = $1.23 in 1997 • Multiply 1990 value by 1.23 (1.16 * 1.23) • So $1.16 in 1990 = $1.42 in 1997
Another Example • Your boss said she made $25,000 a year at her first job out of college in 1993. That doesn't sound like a lot of money to us today, but we must consider that everything was less expensive in 1993. • What is that salary worth in today's money (in 2010)?
Compare Prices in Consecutive Years • Convert entire series of prices to constant dollars • Use Excel
As a Graph… Is this a realistic depiction of the price of electricity?
Huh? • Did price of electricity increase really? • Value of dollar decreased each year • Nominal cost increased • What about constant dollars? • Convert 1986 values to 1997 dollars to find out
Here’s how… • Add a column with CPI for each year • CPI.xls
Then… • Calculate the 1997 equivalent value for each price • 1997 CPI value will remain constant in each equation • Make it an absolute reference (freeze it) by pressing F4 on the keyboard • Fill to the bottom
CPI Graphs $ increases slower than inflation (ex. electricity) $ increases at same rate as inflation (ex. Milk, bread, salary) Change over time Change over time Time (years) Time (years) Change over time $ increases faster than inflation (ex. Gas or cigarettes) Time (years)
Calculating Inflation Rate • Inflation rate is defined as • the percentage change in the CPIs from the previous year to the next. • Inflation Rate in 2008 was • 2008 CPI – 2007 CPI 2007 CPI • 215.3-207.3 = .0386 or 3.86% 207.3
Negative Inflation (or Deflation) • When the price of goods drops over time • Good thing? Bad thing? • Not always good • Example: • 2008 new car costs $30,000 • 2009 expected value is $15,000 • 2010 expected value is $7,500 • Would you purchased a car in 2008 knowing it would cost you less in 2009 or 2010? • Result: consumers stop buying cars, wait for the price to drop more industry dwindles