Download
1 / 23
230 likes | 401 Vues
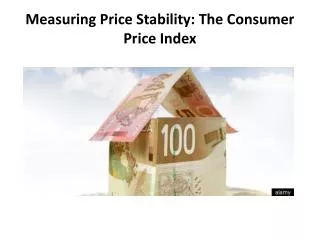
Measuring Price Stability: The Consumer Price Index. Mark Carney Governor of The Bank of Canada. Inflation refers to the general rise in prices from year to year. Statistics Canada measures inflation using the CPI, which tracks price changes in consumer goods.

E N D
Inflation refers to the general rise in prices from year to year. • Statistics Canada measures inflation using the CPI, which tracks price changes in consumer goods. • To do this, a “basket” of over 600 goods and services are sampled. • These items are weighted according to how much the typical household tends to buy in a particular category. • Inflation Rate= (CPI year 2 – CPI year 1) x 100 CPI year 1
The Consumer Price Index (CPI) is an indicator of changes in consumer prices experienced by Canadians. • It is obtained by comparing, over time, the cost of a fixed basket of goods and services purchased by consumers. • Since the basket contains goods and services of unchanging or equivalent quantity and quality, the index reflects only pure price change. • The CPI is widely used as an indicator of the change in the general level of consumer prices or the rate of inflation. • Since the purchasing power of money is affected by changes in prices, the CPI is useful to virtually all Canadians. • Consumers can compare movements in the CPI to changes in their personal income to monitor and evaluate changes in their financial situation.
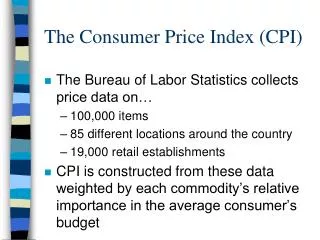
The consumer price index (CPI) • is the most common measure of inflation • monitors price changes in a representative “shopping basket” of consumer products • includes quantities in a shopping basket determined in a base year • compares prices in the current year with those in the base year
The Measurement of Inflation • Inflation is measured by changes in the price level. • There are 3 types of price indexes: • The Consumer Price Index measures price changes in consumer goods. • The Wholesale Price Index measures price changes in primary goods. • The Implicit Price Deflator measures changes in the average price level of all final goods.
Consumer Price Index Weights (2002) • The CPI allows one to compare, in percentage terms, prices in any given time period to prices in the official base period which, at present, is 2002=100. • The official time base was changed from 1992=100 to 2002=100 starting with the CPI for May 2007. • The change is strictly an arithmetic conversion, which alters the index levels, but leaves the percentage changes between any two periods intact, except for differences in rounding.
The Bank of Canada aims to keep inflation at the 2 per cent target, the midpoint of the 1 to 3 per cent inflation-control target range. • This target is expressed in terms of total CPI inflation, but the Bank uses a measure of core inflation as an operational guide. • Core inflation provides a better measure of the underlying trend of inflation and tends to be a better predictor of future changes in the total CPI.
Rule of 70 – Used to estimate GDP growth or Inflation • Approx. # of years required to double inflation • INFLATION • With a 3 percent annual rate of inflation the price level will double in about 23 years (70÷3=23) • Inflation of 8 percent per year will double the price level in about 9 years (70÷8 = 9).
Limitations of the CPI • Category weightings- do they reflect a “typical” household • Items in Base Year basket- may not be realistic e.g. may have been replaced with a new technology. • Cultural Diversity- are not taken into account • The CPI does also does not take full account of • consumer differences, since it is based on the consumption patterns of an average household • changes in spending patterns since it uses base-year quantities • improvements in product quality
Anticipated Inflation • Represents the level of inflation people expect to occur and have built into their economic decisions • Wage contracts and long-term loan contracts are usually the source for judging the expected (anticipated) inflation rate • Economic costs include: • Transaction costs – or “boot-leather costs” b/c people run around trying to avoid losses from the declining value of money • distortion of incentives from the tax system ex. Anticipated inflation increases the the $ return on investments. As these dollar returns are taxed, the tax rate rises • the uncertainty of how and when policy makers will respond to the high level of inflation
Unanticipated Inflation • Is the level of inflation that is not expected or is unforseen • Causes economic costs because people have not adjusted their earnings and expenditures for this level of inflation
Winners and Losers of Unanticipated Inflation The Winners • Inflation results in a redistribution of wealth. • Debtors and producers of goods and services benefit from inflation The Losers • Those who lose as a result of inflation include creditors, people on fixed incomes, and owners of financial assets.
WINNERS & LOSERS OF UNANTICIPATED INFLATION WINNERS • Debtors(borrowers) because they repay later with $ that are worth less • Producers(sellers) because selling prices rise faster that input costs and therefore more profit; buy inputs now at current costs – sell for higher prices • Real Estate Owners because Real estate value will increaseover time LOSERS • Creditors (lenders) because when they arerepaid, the $ will lose purchasing power; the money that is paid back later is worth less in purchasing power • People on Fixed Income because their income remains the same but prices rise (Unless the income is indexed) • Owners of Financial Assets because the realvalue of financial assets will decrease over time