Download
1 / 37
370 likes | 621 Vues
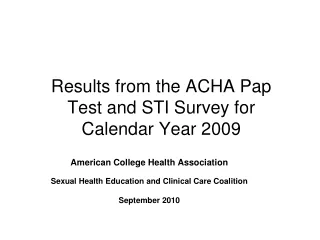
Results from the ACHA Pap Test and STI Survey for Calendar Year 2008. American College Health Association Sexual Health Education and Clinical Care Coalition September 2009. Participation. CY 2008 survey (Web-based) 176 Respondents CY 2007 survey (Web-based) 128 Respondents

E N D
Results from the ACHA Pap Test and STI Survey for Calendar Year 2008 American College Health Association Sexual Health Education and Clinical Care Coalition September 2009
Participation • CY 2008 survey (Web-based) • 176 Respondents • CY 2007 survey (Web-based) • 128 Respondents • CY 2006 survey (Web-based) • 128 Respondents • CY 2005 survey (Web-based) • 147 Respondents • CY 2004 survey (Web-based) • 135 Respondents • CY 2003 survey (Paper-based) • 85 Respondents
Demographics • Total Enrollment 2,822,008 • Range 500-51,413 • Mean 16,034 • Mean Percent Female enrolled 55
Demographics cont’d • Total Medical Visits 3,234,438 • Range 47-91,079 • Mean 19,139 • Percent Female Visits • Mean 64% • Women’s Health Visits 533,699 • Range 7-38,301 • Mean 3656
ASC-US Outcomes • 6476 Documented first ASC-US Cases • 3786 (58.5%) HPV DNA testing • 52.8% positive for HR HPV • 797 (12.3%) for repeat cytology • 36.1% ≥ ASC-US
CT Testing Results excludes respondents with missing or unpaired test result data
GC Testing Results excludes respondents with missing or unpaired test result data
HIV Test Results • 158 schools (89.8%) report offering HIV screening to their students • 141 schools reporting reliable test data • 52,368 tests done • 55 positive tests (0.11%) excludes respondents with missing or unpaired test result data
Syphilis Testing • 155 (87.6%) schools report offering syphilis testing • 134 schools reporting reliable testing data • 34,047 tests done • 85 positive tests (0.25%) excludes respondents with missing or unpaired test result data
HSV Testing Results by HSV Type note: many positive tests reported were of unknown type (n=1068 all, 258 female, 64 male)
HPV Vaccine • 136 respondents reported: • 40,087 total doses HPV vaccine given • 23,342 total students vaccinated • estimated female enrollment 1,058,555 • vaccine provided to 2.2% of enrolled ♀ students • Paired data was available from 114 respondents: • 33,192 doses given to 23,242 students • 1.4 doses per student