Download
1 / 12
120 likes | 253 Vues
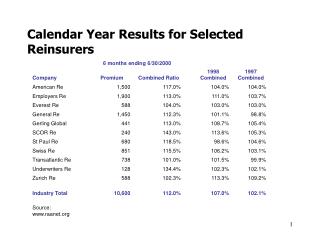
6 months ending 6/30/2000. Company. Premium. Combined Ratio. 1998 Combined. 1997 Combined. American Re. 1,500. 117.0%. 104.0%. 104.0%. Employers Re. 1,900. 113.0%. 111.0%. 103.7%. Everest Re. 588. 104.0%. 103.0%. 103.0%. General Re. 1,450. 112.3%. 101.1%. 98.8%.

E N D
6 months ending 6/30/2000 Company Premium Combined Ratio 1998 Combined 1997 Combined American Re 1,500 117.0% 104.0% 104.0% Employers Re 1,900 113.0% 111.0% 103.7% Everest Re 588 104.0% 103.0% 103.0% General Re 1,450 112.3% 101.1% 98.8% Gerling Global 441 113.0% 108.7% 105.4% SCOR Re 240 143.0% 113.6% 105.3% St Paul Re 680 118.5% 98.6% 104.6% Swiss Re 851 115.5% 106.2% 103.1% Transatlantic Re 738 101.0% 101.5% 99.9% Underwriters Re 128 134.4% 102.3% 102.1% Zurich Re 588 102.3% 113.3% 109.2% Industry Total 10,600 112.0% 107.0% 102.1% Source: www.raanet.org Calendar Year Results for Selected Reinsurers
AY Loss Selections and Ultimates 12 24 36 1997 100 125 135 AY Prm Obs Loss Sel FTU CL Ult Ult LR 1998 110 128 1999 112 1997 165 135 1.000 135 81.8% 1998 165 128 1.080 138 83.8% Link Ratios 1999 165 112 1.296 145 88.0% AY 12 : 24 24 : 36 Projected Loss Development Triangle 1997 1.250 1.080 AY Loss 12 24 36 1998 1.164 Average 1.200 1.080 1997 100 125 135 FTU 1.296 1.080 1.000 1998 110 128 138 1999 112 134 145 Simple Loss Development Example
Cumulative 12 24 36 48 60 72 84 96 108 120 1990 1,473 3,858 8,590 9,192 9,831 9,950 10,101 12,549 12,578 12,583 1991 491 2,824 5,533 7,111 7,782 7,902 7,942 7,971 8,436 1992 639 1,962 4,138 5,940 7,082 7,567 7,617 8,045 1993 783 3,276 4,763 5,561 6,051 6,175 6,342 1994 1,471 3,189 6,242 8,925 10,066 10,248 1995 971 2,207 3,774 4,927 6,257 1996 1,035 2,436 4,332 11,334 1997 949 1,763 5,324 1998 24 4,724 1999 906 Simulated Example, Losses $000
Cumulative 12 24 36 48 60 72 84 96 108 120 1990 1,473 3,858 8,590 9,192 9,831 9,950 10,101 12,549 12,578 12,583 1991 491 2,824 5,533 7,111 7,782 7,902 7,942 7,971 8,436 1992 639 1,962 4,138 5,940 7,082 7,567 7,617 8,045 1993 783 3,276 4,763 5,561 6,051 6,175 6,342 1994 1,471 3,189 6,242 8,925 10,066 10,248 1995 971 2,207 3,774 4,927 6,257 1996 1,035 2,436 4,332 11,334 1997 949 1,763 5,324 1998 24 4,724 1999 906 Link Ratios AY 12 : 24 24 : 36 36 : 48 48 : 60 60 : 72 72 : 84 84 : 96 96 : 108 108 : 120 1990 2.619 2.227 1.070 1.070 1.012 1.015 1.242 1.002 1.000 1991 5.750 1.959 1.285 1.094 1.015 1.005 1.004 1.058 1992 3.073 2.109 1.435 1.192 1.068 1.007 1.056 1993 4.182 1.454 1.167 1.088 1.020 1.027 1994 2.168 1.957 1.430 1.128 1.018 1995 2.273 1.710 1.306 1.270 1996 2.354 1.779 2.616 1997 1.858 3.020 1998 199.966
Link Ratios AY 12 : 24 24 : 36 36 : 48 48 : 60 60 : 72 72 : 84 84 : 96 96 : 108 108 : 120 1990 2.619 2.227 1.070 1.070 1.012 1.015 1.242 1.002 1.000 1991 5.750 1.959 1.285 1.094 1.015 1.005 1.004 1.058 1992 3.073 2.109 1.435 1.192 1.068 1.007 1.056 1993 4.182 1.454 1.167 1.088 1.020 1.027 1994 2.168 1.957 1.430 1.128 1.018 1995 2.273 1.710 1.306 1.270 1996 2.354 1.779 2.616 1997 1.858 3.020 1998 199.966 Averages Strt All 24.916 2.027 1.473 1.140 1.027 1.014 1.101 1.030 1.000 Last 5 41.724 1.984 1.591 1.155 1.027 1.014 1.101 1.030 1.000 Last 3 68.059 2.169 1.784 1.162 1.036 1.013 1.101 1.030 1.000 Wtd All 3.349 1.984 1.418 1.130 1.025 1.013 1.113 1.024 1.000 Wtd L5 3.218 1.898 1.578 1.147 1.025 1.013 1.113 1.024 1.000 Wtd L3 4.446 2.096 1.755 1.153 1.034 1.012 1.113 1.024 1.000 Selected 3.500 2.000 1.500 1.110 1.080 1.060 1.040 1.024 1.010 FTU 14.353 4.101 2.050 1.367 1.231 1.140 1.076 1.034 1.010 Pct Ult 7.0% 24.4% 48.8% 73.2% 81.2% 87.7% 93.0% 96.7% 99.0%
Selections and Ultimates View I: Premium Based Exposure AY EP Obs Loss Sel FTU Prior LR CL Ult CL LR 1990 14,757 12,583 1.000 80.0% 12,583 85.3% 1991 13,782 8,436 1.010 80.0% 8,520 61.8% 1992 11,951 8,045 1.034 80.0% 8,322 69.6% 1993 11,624 6,342 1.076 80.0% 6,822 58.7% 1994 11,277 10,248 1.140 80.0% 11,685 103.6% 1995 10,735 6,257 1.231 80.0% 7,705 71.8% 1996 10,092 11,334 1.367 80.0% 15,492 153.5% 1997 9,659 5,324 2.050 80.0% 10,916 113.0% 1998 8,305 4,724 4.101 80.0% 19,372 233.2% 1999 9,464 906 14.353 80.0% 13,009 137.5% Chain Ladder Ultimate Losses
Selections and Ultimates View I: Premium Based Exposure AY EP Obs Loss Sel FTU Prior LR CL Ult CL LR BF Ult BF LR 1990 14,757 12,583 1.000 80.0% 12,583 85.3% 12,583 85.3% 1991 13,782 8,436 1.010 80.0% 8,520 61.8% 8,545 62.0% 1992 11,951 8,045 1.034 80.0% 8,322 69.6% 8,363 70.0% 1993 11,624 6,342 1.076 80.0% 6,822 58.7% 6,997 60.2% 1994 11,277 10,248 1.140 80.0% 11,685 103.6% 11,357 100.7% 1995 10,735 6,257 1.231 80.0% 7,705 71.8% 7,871 73.3% 1996 10,092 11,334 1.367 80.0% 15,492 153.5% 13,501 133.8% 1997 9,659 5,324 2.050 80.0% 10,916 113.0% 9,283 96.1% 1998 8,305 4,724 4.101 80.0% 19,372 233.2% 9,748 117.4% 1999 9,464 906 14.353 80.0% 13,009 137.5% 7,950 84.0% Bornhuetter-Ferguson Ultimates
Selections and Ultimates View II: Unit Based Exposure AY Units Obs Loss Sel FTU Prem/Unit CL Ult CL LR BF Ult BF LR 1990 123 12,583 1.000 120 12,583 85.3% 12,583 85.3% 1991 125 8,436 1.010 110 8,520 61.8% 8,572 62.2% 1992 120 8,045 1.034 100 8,322 69.6% 8,442 70.6% 1993 122 6,342 1.076 95 6,822 58.7% 7,160 61.6% 1994 125 10,248 1.140 90 11,685 103.6% 11,635 103.2% 1995 126 6,257 1.231 85 7,705 71.8% 8,275 77.1% 1996 126 11,334 1.367 80 15,492 153.5% 14,043 139.1% 1997 129 5,324 2.050 75 10,916 113.0% 10,272 106.3% 1998 128 4,724 4.101 65 19,372 233.2% 11,004 132.5% 1999 126 906 14.353 75 13,009 137.5% 9,711 102.6% Exposure Adjustment
Incremental 12 24 36 48 60 72 84 96 108 120 1990 1,473 2,385 4,732 602 639 119 152 2,447 29 6 1991 491 2,333 2,709 1,578 671 120 41 28 465 1992 639 1,324 2,176 1,802 1,143 485 50 429 1993 783 2,493 1,487 797 491 124 167 1994 1,471 1,718 3,053 2,682 1,142 182 1995 971 1,236 1,567 1,153 1,330 1996 1,035 1,401 1,896 7,001 1997 949 814 3,561 1998 24 4,700 1999 906 Average 874 2,045 2,648 2,231 902 206 102 968 247 6 Est IBNR 10,229 9,355 7,310 4,662 2,431 1,529 1,323 1,221 253 6 True IBNR 10,000 9,000 7,054 4,135 2,189 1,216 730 341 146 49 Alternative Estimate of Unpaid Loss
Selections and Ultimates View III: Additive Method and Actuals AY Obs Loss Est IBNR Est Ult Est Ult LR Actual IBNR Actual Ult Actual Ult LR Expected LR 1990 12,583 0 12,583 85.3% 0 12,583 85.3% 66.7% 1991 8,436 6 8,442 61.2% 49 8,484 61.6% 72.7% 1992 8,045 253 8,298 69.4% 146 8,191 68.5% 80.0% 1993 6,342 1,221 7,563 65.1% 341 6,683 57.5% 84.2% 1994 10,248 1,323 11,571 102.6% 730 10,978 97.3% 88.9% 1995 6,257 1,529 7,786 72.5% 1,216 7,473 69.6% 94.1% 1996 11,334 2,431 13,765 136.4% 2,189 13,523 134.0% 100.0% 1997 5,324 4,662 9,986 103.4% 4,135 9,459 97.9% 106.7% 1998 4,724 7,310 12,034 144.9% 7,054 11,778 141.8% 123.1% 1999 906 9,355 10,261 108.4% 9,000 9,906 104.7% 106.7% Additive Method
Comparison of Methods AY CL BF BF (units) Est IBNR Actual IBNR Exp LR Hi Low 1990 85.3% 85.3% 85.3% 85.3% 85.3% 66.7% 85.3% 66.7% 1991 61.8% 62.0% 62.2% 61.2% 61.6% 72.7% 72.7% 61.2% 1992 69.6% 70.0% 70.6% 69.4% 68.5% 80.0% 80.0% 68.5% 1993 58.7% 60.2% 61.6% 65.1% 57.5% 84.2% 84.2% 57.5% 1994 103.6% 100.7% 103.2% 102.6% 97.3% 88.9% 103.6% 88.9% 1995 71.8% 73.3% 77.1% 72.5% 69.6% 94.1% 94.1% 69.6% 1996 153.5% 133.8% 139.1% 136.4% 134.0% 100.0% 153.5% 100.0% 1997 113.0% 96.1% 106.3% 103.4% 97.9% 106.7% 113.0% 96.1% 1998 233.2% 117.4% 132.5% 144.9% 141.8% 123.1% 233.2% 117.4% 1999 137.5% 84.0% 102.6% 108.4% 104.7% 106.7% 137.5% 84.0% Summary of Methods