Synergy of Geophysical and Remote Sensing Data at Department of Defense Archaeological Sites
This study explores the integration of archeo-geophysical data with multispectral and thermal imaging to enhance archaeological site evaluations at multiple DoD and DoE locations. Notable sites investigated include Silver Bluff in SC and Key Kasita Town in GA. Using methods like principal components analysis and multi-layer compositing, we reveal critical spatial information through advanced visualization. Results demonstrate improved detection of subsurface features, showcasing the effectiveness of data synergy in archaeological research.

Synergy of Geophysical and Remote Sensing Data at Department of Defense Archaeological Sites
E N D
Presentation Transcript
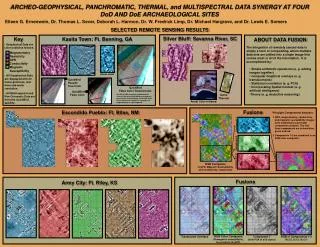
ARCHEO-GEOPHYSICAL, PANCHROMATIC, THERMAL, and MULTISPECTRAL DATA SYNERGY AT FOUR DoD AND DoE ARCHAEOLOGICAL SITES Eileen G. Ernenwein, Dr. Thomas L. Sever, Deborah L. Harmon, Dr. W. Fredrick Limp, Dr. Michael Hargrave, and Dr. Lewis E. Somers SELECTED REMOTE SENSING RESULTS Silver Bluff: Savanna River, SC Key Kasita Town: Ft. Benning, GA ABOUT DATA FUSION • Geophysical Data are color-coded as follows: • The integration of remotely sensed data is simply a form of compositing, where multiple data sets are unified into a single image that carries most or all of the information. It is accomplished by: • Simple arithmetic operations (e. g. adding images together) • Computer Graphical overlays (e. g. translucencies) • Statistical correlation (e. g. PCA) • Incorporating Spatial Context (e. g. artificial intelligence) • Theory (e. g. deductive reasoning) MagnetometryResistivityGPRConductivityMagnetic Susceptibility GPR Grid House detail • All Geophysical Data are displayed with 20-meter grid lines, and have sub-meter resolution. • All Multi-spectral and Pan-Chromatic Data are from the QuickBird satellite. QuickBird Psuedo True Color QuickBirdFalse Color Transformed: An HIS to RGB transform substituted the contrast enhanced QuickBird panchromatic band for the intensity band, in this NIR, Blue, Green false-color composite. Geophysical magnetometry is superimposed. QuickBird False Color Aerial Thermal Aerial Color Infrared Fusions Escondido Pueblo: Ft. Bliss, NM • Principle Components Analysis: • GPR, magnetometry, conductivity, and magnetic susceptibility images were subjected to a principle components.analysis. The first three components are colored blue, green and red. • Components 1-3 are combined in an RGB color composite. Component 1 Component 2 Component 3 RGB Compositeof GPR, Magnetic Susceptibility, and Conductivity, respectively Fusions Army City: Ft. Riley, KS RGB Color Composite(R=magnetic susceptibility, G=resistivity, B=GPR) Translucent Overlays Component 1(from PCA of all 5 layers) RGB of Components 1-3(R=C2, G=C3. B=C1)