
Forecasting Walleye Pollock Population Dynamics Under Climate Change in the Bering Sea
E N D
Presentation Transcript
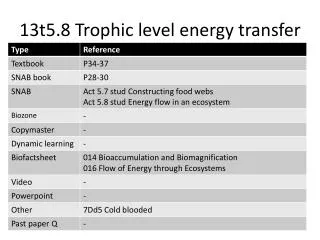
BSIERPIntegrated modeling 2 Economic/ecological model FEAST Higher trophic level model Observational Data NPZ-B-D Lower trophic level ROMS Physical Oceanography BEST Nested models Climate scenarios
Goal • Provide forecasts of future population trajectories of walleye pollock under anticipated climate warming; complement the vertically-integrated modeling effort
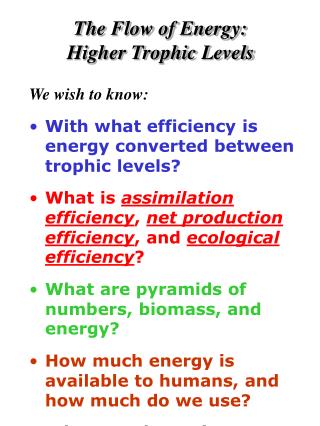
Projections of Key Environmental Parameters for the Bering Sea: Empirical Downscaling from Global Climate Models Nick Bond1, Franz Mueter2, Muyin Wang1, Anne Hollowed3, Carol Ladd4 1 Joint Institute for the Study of the Atmosphere and Ocean, UW 2 School of Fisheries & Ocean Sciences, UAF 3 Alaska Fisheries Science Center, NOAA 4 Pacific Marine Environmental Laboratory, NOAA
(Late) summer conditions Spring conditions Summer SST Timing of ice retreat Spring SST Wind mixing Stability Prey Prey Predation Biomass Consumption rate Prey composition Spatial distribution
Variables considered • Timing of ice retreat • Date when average ice cover on southeast Bering Sea shelf first decreases below 20% (updated from Mueter et al 2006) • Spring transition • Proxy for onset of thermal stratification based on change in SST (NOAA Extended Reconstructed SST, Smith et al. 2008) • Late summer SST • Mean Jul-Sep SST (NOAA ERSST) over shelf • Summer wind mixing • Mean May-July wind mixing (NCEP reanalysis, Kalnay et al. 1996)
Variables considered (cont’d) • Water column stability • Mooring 2 observations & proxy based on1-D model estimates • Predation pressure (1977-2008) • Index of pollock predation based on consumption rate and average prey composition in early 1990s estimated in Aydin et al (2007) • Spatial distribution (juveniles, adults) • Anomalies in spatial distribution based on summer trawl survey (Spatial EOF/PCA)
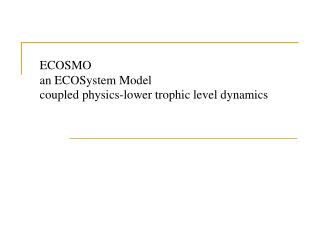
Estimated effects of summer SST & predation on log-recruitment Prediction interval Med Low High Simulate effect of increase in average SST on recruitment at three levels of predation R2 =0.44 P = 0.001
Median R Predicted distribution of pollock recruitment under 0.5oC and 1oC warming (relative to 1977-2001) Assuming predation equal to 1977-2007 mean (dashed): With 0.5 oC warming: 10% decline in median R 31% exceed ‘77-’07 average R With 1 oC warming: 30% decline in median R 19% exceed ‘77-’07 average R o o
H3: Winners and losers Piscivorous fish abundance will increase. Competition with abundant, piscivorous fish will lead to a decline in murres, kittiwakes and fur seals. Growing populations of humpback and fin whales increasingly will both consume and compete with forage fish (including juvenile pollock) for zooplankton.
2000s 2010s 2020s 2030s 2040s > 2050 Time of collapse based on 6-year running mean of recruitment estimated from SST (constant predation) falling below 10% of present day median value
Summary and Next Steps • Late summer/early fall conditions during larval stage are best predictors of recruitment • Simulations suggest a considerable reduction in average recruitment of walleye pollock under moderate warming • Recruitment model will be revisited; potential predictors such as stratification may be added • All of the sources of uncertainty (model, regional factors, global climate) will be quantified • Projections will be made available for MSE