Download
1 / 23
230 likes | 262 Vues
Explore the efficiency of energy conversion, pyramids of numbers, biomass, and energy, and major controls on ecosystem function. Learn about assimilation efficiency, net production efficiency, and ecological efficiency in higher trophic levels.

E N D
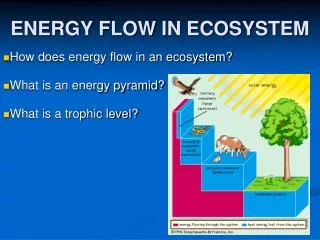
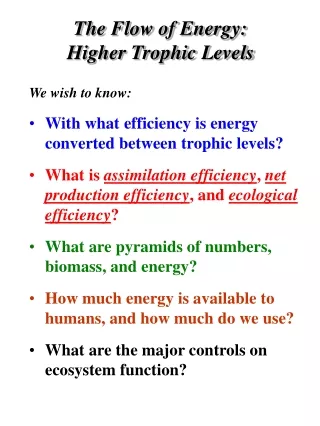
The Flow of Energy: Higher Trophic Levels We wish to know: • With what efficiency is energy converted between trophic levels? • What is assimilation efficiency, net production efficiency, and ecological efficiency? • What are pyramids of numbers, biomass, and energy? • How much energy is available to humans, and how much do we use? • What are the major controls on ecosystem function?
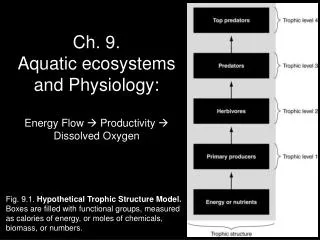
Energy Transfers to Higher Trophic Levels What happens to NPP? On average, it is consumed. Some is stored in sediments (coal, oil). Energy is released in this consumption, and metabolic work is done as cellular respiration converts energy stored in chemical bonds into heat. This energy is lost for the next trophic level.
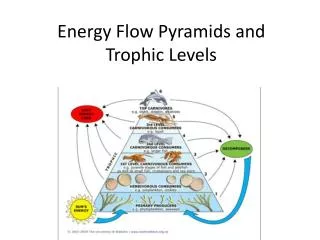
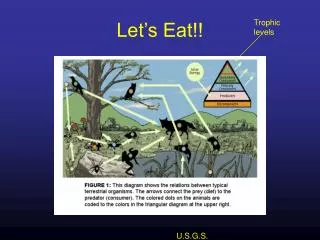
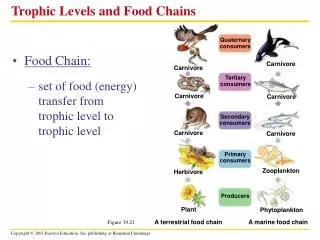
Principles of Energy Flow As energy passes from trophic level to trophic level: • Only a fraction of the energy available to one trophic level is transferred to the next trophic level. The rule of thumb is ~10%, but this can vary from 1 - 15%. • Typically the numbers and biomass of organisms decreases as one ascends the food chain. This is called a “pyramid”.
1. “Assimilation Efficiency”= (Assimilation / Ingestion) Assimilation = (Ingestion) – (Excretion) Assimilation Efficiency = 15 – 50 % for plant food = 16 – 90 % for animal food
2. “Net Production Efficiency”= (Production / Assimilation) • Production= (Growth + Reproduction) • For plants, net production efficiency • = (NPP / GPP) = 30-85% • For invertebrates = 20% on average • For vertebrates = 2% on average WHY ?
3. “Ecological Efficiency” = consumer production / prey production For example, = Fox production/Rabbit production = [(10 kg/yr)/ (100 kg/yr) ] * 100 = 10 % * Ecological efficiency ranges from ~1 to 15 % * This sets the absolute number of trophic levels in a food web
Pyramids of Numbers, Biomass, and Energy • Because energy is “used up” by the metabolic activities of organisms, the amount of energy available to the next trophic level (e.g., foxes) is less than the amount that entered the trophic level below (e.g., hares). • In general, this lower amount of energy available leads to a decrease in standing crop biomass or numbers of organisms as one proceeds to higher trophic levels.
Pyramids -- complications and exceptions • Complications: pyramids of numbers might be steepif the predators are much larger than their prey, - or -, they might be inverted if large plants have numerous insect grazers. • Exceptions: pyramids of biomass might be inverted if a lower trophic level has a much higher turnover rate than a higher trophic level. • Pyramids of energy can never be inverted.
Residence Time of Energy • RT= ( energy in biomass/ net productivity )
World NPP & Human Consumption • World NPP is ~ 224.5 Pg/yr of organic matter. • 1 pedagram = 1015 g = 109 metric tonnes (1 metric tonne = 1,000 kg) • Terrestrial NPP > Aquatic NPP(despite oceans covering 70% of earth’s surface)
The Low Calculation SourceNPP used Cultivated land, food 0.8 Pg Domestic animal fodder 2.2 Pg Wood products construction and fiber 1.2 Pg firewood 1.0 Pg Fisheries 2.0 Pg Total 7.2 Pg Percent NPP = 3.2 % (7.2/224.5)*100
The Intermediate Calculation Source NPP co-opted (Pg) Cultivated land 15.0 Grazing Land 11.6 Forest land 13.6 Human-occupied areas 0.4 Sub-total terrestrial40.6 Fisheries 2.0 Total 42.6 % terrestrial NPP co-opted (40.6/132.1) 30.7 %
The High Calculation Source Amount (Pg) Previous terrestrial total 40.6 Decreased NPP in agriculture 9.0 Conversion forest to pasture 1.4 Desertification 4.5 Loss to settlement 2.6 Sub-total terrestrial 58.1 % Terrestrial co-opted (58.1/149.8) 38.8 % % Total NPP co-opted (60.1/224.5) 24.8 %
World NPP & Human Consumption • Low calculation = 7.2 Pg (3.2%) annually (direct use as food, fiber, fuel, timber) • Intermediate estimate = 42.6 Pg (31%) annually (direct use and amount co-opted) • High estimate = 58.1 Pg (39%) annually (direct use, co-opted NPP, and forgone NPP)
Implications of Human Co-option of NPP: • Human use of marine productivity is small • On land, 1 species commands almost 40% of NPP • Consequences include environmental degradation, species extinctions, altered climate • What is the human carrying capacity of the planet? Being Alive - vs.- Having a life
Take-Home Message: “Ecological efficiency will get us in the end.”
Summary (so far…) • Only a small percentage of the sun’s energy is converted into NPP. • Only a fraction (~10%) of the energy entering one trophic level reaches the next trophic level. • Numbers and biomass of organisms usually decrease as one ascends the food chain. • Humans consume, co-opt, or make unavailable almost 40% of the world’s total terrestrial NPP, but use only a small fraction of aquatic NPP.
Controls on Ecosystems 2 Theories: • Nutrient supply drives 1o Prod, and 1o production drives 2o production … = “Bottom-Up” Control 2. Predation and grazing control all trophic levels … = “Top-Down” Control
Which theory is correct? • Bottom-up applies “direct” control upward on trophic levels • Top-down applies “alternating” control downward on trophic levels * Evidence to date shows that both theories operate and exert control, but not complete control, on ecosystems. Nutrients 1o 2o 3o Top Producers Prods Prods Predators “Bottom-Up”“Top-Down” Effect StrongEffect Strong (Top-Down Weak)(Bottom-Up Weak)