The Hardy-Weinberg Equilibrium
140 likes | 912 Vues
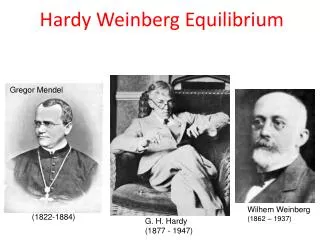
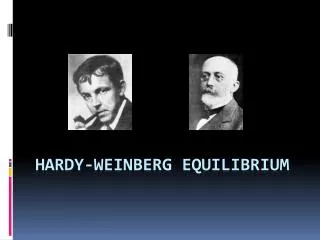
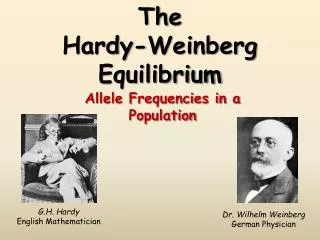
The Hardy-Weinberg Equilibrium. Allele Frequencies in a Population. G.H. Hardy English Mathematician. Dr. Wilhelm Weinberg German Physician. Hardy-Weinberg Equilibrium. “Allele and genotype frequencies in a population tend to remain constant in the absence of disturbing influences ”.

The Hardy-Weinberg Equilibrium
E N D
Presentation Transcript
TheHardy-WeinbergEquilibrium Allele Frequencies in a Population G.H. Hardy English Mathematician Dr. Wilhelm Weinberg German Physician
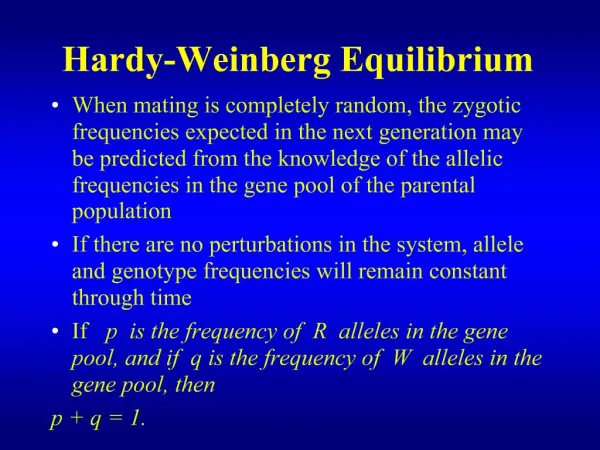
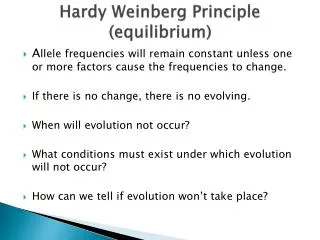
Hardy-Weinberg Equilibrium “Allele and genotype frequencies in a population tend to remain constant in the absence of disturbing influences” Disturbing influences: non-random mating mutations selection limited population size random genetic drift gene flow migration
In Reality… The conditions for Hardy-Weinberg equilibrium are never met in nature. • There are always some disturbing influences in nature • Hardy-Weinberg equilibrium can be approximated in the lab • It has usefulness as a model for studying real populations
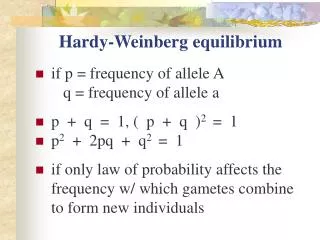
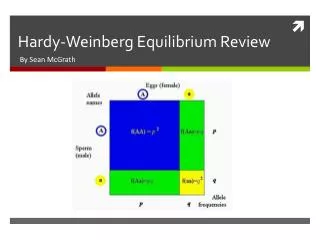
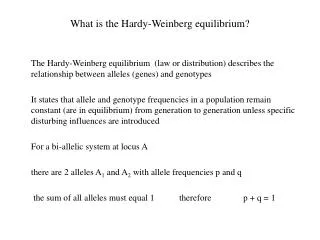
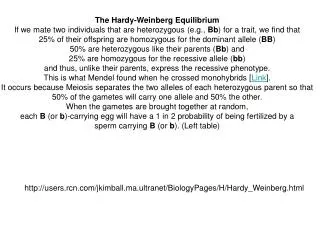
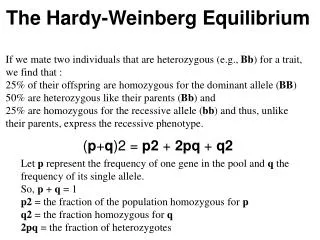
The Equations p + q = 1 p2 + 2pq + q2 = 1 A gene has two alleles, A and a The frequency of allele A is represented by p The frequency of allele a is represented by q The frequency of genotype AA = p2 The frequency of genotype aa = q2 The frequency of genotype Aa = 2pq
An Example… Assume a population in which 36% of the population are homozygous for a certain recessive allele, a. Assume the population is at equilibrium. Question #1: What is the frequency of the recessive allele, a in this population?
An Example… Assume a population in which 36% of the population are homozygous for a certain recessive allele, a. Assume the population is at equilibrium. Question #2: What is the frequency of the dominant allele, A in this population?
An Example… Assume a population in which 36% of the population are homozygous for a certain recessive allele, a. Assume the population is at equilibrium. Question #3: What percentage of the population are homozygous for the dominant allele, A?
An Example… Assume a population in which 36% of the population are homozygous for a certain recessive allele, a. Assume the population is at equilibrium. Question #4: What percentage of the population are heterozygous for this trait?
An Example… Assume a population in which 36% of the population are homozygous for a certain recessive allele, a. Assume the population is at equilibrium. Question #5: Why do we have to start the problem with the percentage of the homozygous recessive in the population? Answer:It is not possible to tell the homozygous dominant (AA) from the heterozygous (Aa) by examining the phenotype!