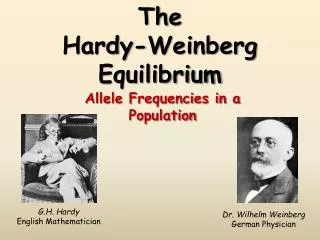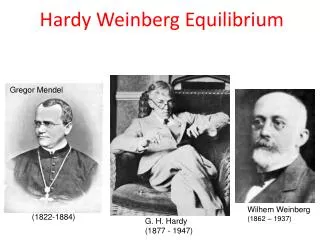
Hardy-Weinberg Equilibrium
130 likes | 423 Vues
Hardy-Weinberg Equilibrium. Journal Entry #3. Is the population of Canada in equilibrium? Why or why not?. Hardy-Weinberg Equilibrium. The frequency of alleles for a trait in a stable population will not vary ( ie . Stays the same) Equation: p + q = 1 Where p = frequency of one allele

Hardy-Weinberg Equilibrium
E N D
Presentation Transcript
Journal Entry #3 • Is the population of Canada in equilibrium? • Why or why not?
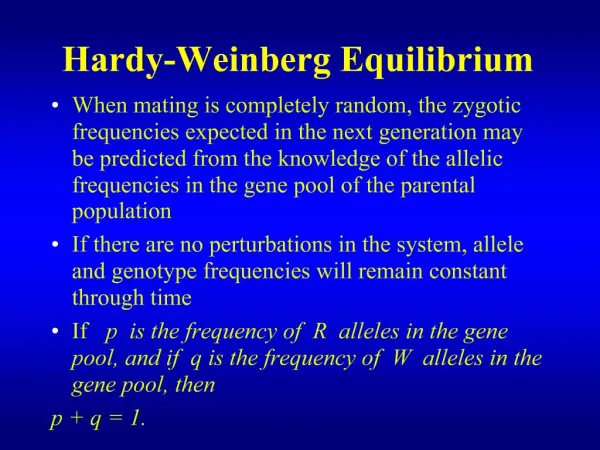
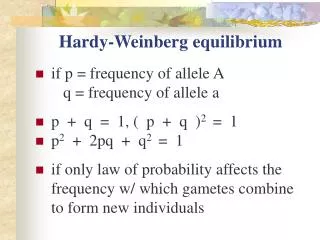
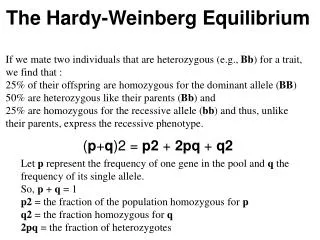
Hardy-Weinberg Equilibrium • The frequency of alleles for a trait in a stable population will not vary (ie. Stays the same) • Equation: • p + q = 1 • Where p = frequency of one allele • q = frequency of the other allele • The SUM of the alleles always equals 100% or in terms of decimals, 1.
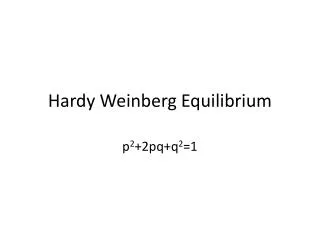
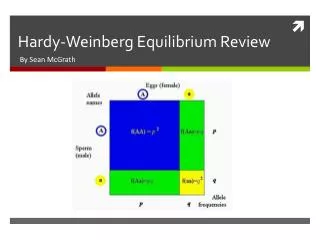
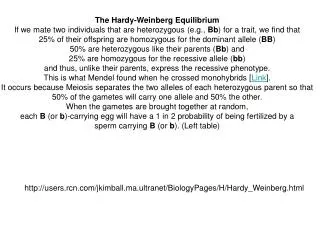
Formula • p2 + 2pq + q2 = 1 • Used to determine the frequency of genotypes in a population • p2 = # of homozygous dominant individuals in a population • 2pq = # of heterozygous individuals • q2 = # of homozygous recessive individuals
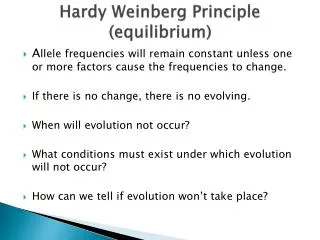
Why is it useful? • It explains that the genotypes in populations tend to remain the same • Because a recessive allele may be masked by a dominant allele it is useful to determine the frequency of the recessive allele in the population • Helpful for studying natural populations to determine how much natural selection is occurring in the population
Example: • Suppose that in a population of pea plants: • 36 plants are TT • 48 plants are Tt • 16 plants are tt • In the homozygous dominant plants: • 36 x 2 = 72 T alleles (because each plant has 2) • In the 48 Tt, there are 48 T alleles and 48 t alleles • 16 x 2 = 32 t alleles (because each plant has 2) • Therefore: • Total alleles = 72+48+48+32 = 200 alleles • p = (72 + 48)/200 = 0.6 • q = (48 + 32)/200 = 0.4
Using the value of p = 0.6 and q = 0.4 you can find the frequency of each genotype in the population. • p2 + 2pq + q2 = 1 • (0.6)(0.6) + 2(0.6)(0.4) + (0.4)(0.4) = 1 • 0.36 + 0.48 + 0.16 = 1 • Therefore, • 0.36 or 36% of the population is TT • 0.48 or 48% of the population is Tt • 0.16 or 16% of the population is tt
Example #2: • If in a population of monkeys the value of p = 0.22 and the value of q = 0.78, determine the amount of monkeys that are homozygous recessive for fur colour if the population size is 500. • p2 + 2pq + q2 = 1 • (0.22)(0.22) + 2(0.22)(0.78) + (0.78)(0.78) = 1 • 0.05 + 0.34 + 0.61 = 1 • 0.61 or 61% of the population are homozygous recessive
If 61% (0.61) of the population are homozygous recessive, what number out of 500 is this? • (0.61)(500) = 305 monkeys are homozygous recessive for fur colour.
Video: Hardy-Weinberg • http://www.khanacademy.org/science/biology/v/hardy-weinberg-principle