Demystifying Power Analysis
Demystifying Power Analysis . Anne Hunt, S.D. Office of Methodological Data Sciences. Presentation Structure. E ffect sizes, p-values, and power Language of Power Analysis Conducting a Power Analysis Power Analysis = Fuzzy Science Resources. Effect sizes, P-values, & Power.

Demystifying Power Analysis
E N D
Presentation Transcript
Demystifying Power Analysis Anne Hunt, S.D. Office of Methodological Data Sciences
Presentation Structure • Effect sizes, p-values, and power • Language of Power Analysis • Conducting a Power Analysis • Power Analysis = Fuzzy Science • Resources
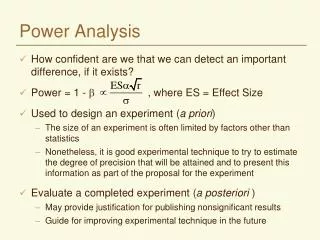
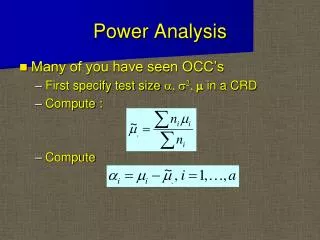
Effect sizes, P-values, & Power • Two measures of effect used in research: effect sizes & p-values • Effect size (ES): measures the strength of the phenomenon of interest; solely magnitude based - does not depend on sample size • e.g. Is there a difference in mean scores between the intervention & control group? • Nint= 4 , Meanint = 90, SDint = 5 • Nctl= 4, Meanctl= 85, SDctl= 5 • ES = (Meanint – Meanctl)/pooled SD = (90-85)/5 = 1.0 (a large effect) • Statistical significance (p-values) - dependent on sample size • A Mann-Whitney test or t-test for this data gives a non-significant p-value even though there is a large effect • A power analysis shows that at least 14 subjects are needed in each group to prove this effect with inferential statistics
Effect sizes, P-values, & Power • Effect sizes (ES) &p-values do not always align • Small studies (< 100) may have medium or large effect but not yield statistically significant p-values • Large studies (> 2000) may have small and often inconsequential effects but be statistically significant • Mid-size studies (> 100 and < 2000) usually have agreement in that medium to large effects generally also yield a p-value < .05 • Important in ALL studies to report both effect sizes and p-values and to do a power analysis
Effect sizes, P-values, & Power • What is power? • The probability of detecting an existing effect with statistical inference (i.e. via p-values) • Why do we need a power analysis? • Sufficient power to find statistical significance (p-value) minimizes chance findings & is critical to • Funding research • Conducting statistical analysis • Publishing results • Exception: pilot studies, which rely on effect sizes
Language of Power Analysis • Four parameters – must ‘know’ 3 and solve for the 4th • Alpha: • Probability of finding significance where there is none • False positive • Probability of a Type I error • Usually set to .05 • Power • Probability of finding true significance • True positive • 1 – beta, where beta is : • Probability of not finding significance when it is there • False negative • Probability of a Type II error • Usually set to .80
Language of Power Analysis • Four parameters – must ‘know’ 3 and solve for the 4th (cont.) • N: • The sample size (usually the parameter you are solving for) • May be known and fixed due to study constraints • Effect size: • Usually the ‘expected effect’ is ascertained from: • Pilot study results • Published findings from a similar study or studies • May need to be calculated from results if not reported • May need to be translated as design specific using rules of thumb • Field defined ‘meaningful effect’ • Educated guess (based on informal observations and knowledge of the field)
Language of Power Analysis • Types of power analysis: • A priori: compute N, given alpha, power, ES • Post-hoc: compute power, given alpha, N, ES • Criterion: compute alpha, given power, ES, N • Sensitivity: compute ES, given alpha, power, N
Language of Power Analysis Study design impacts power calculations and the interpretation of effect sizes
Conducting a Power Analysis • Software for Power Analysis: • GPower (PC or Mac) • Free download with tutorial manual • Easy to use • Supports many designs (t-test, ANOVA, ANCOVA, repeated measures, correlations, regression, logistic, proportions, Chi-sq, nonparametric equivalents) • Includes an effect size calculator • Optimal Design (PC) • Free download with tutorial manual • Supports multi-level randomized control trials • Other options: SPSS Sample Power, SAS Proc Power, Pint, PASS
Conducting a Power Analysis Steps in conducting a power analysis: Select the type of power analysis desired (a priori, post-hoc, criterion, sensitivity) Select the expected study design that reflects your hypotheses of interest (e.g. t-test, ANOVA, etc.) Select a power analysis tool that supports your design Provide 3 of the 4 parameters (usually alpha=.05, power = .80, expected effect size, preferably supported by pilot data or the literature) Solve for the remaining parameter, usually sample size (N)
Conducting a Power Analysis e.g. Using the prior pilot data with an ES=1, determine the sample size needed to detect this level of expected effect using inferential statistics (i.e. p-values)
Conducting a Power Analysis To check the effect size as the study progresses to see if the expected effect is realistic, and adjust recruitment accordingly, use a running power analysis for the design of interest
Power Analysis = Fuzzy Science When using power analysis to calculate N, the expected ES may not align with the actual effect found as each study is unique in protocol, population studied, covariates & factors considered, etc. i.e. the expected effect size is an educated guess When using power analysis to calculate the minimal detectable effect (MDE), the expected sample size may not align with the final N due to missing data or differing attrition rates. i.e. the expected N is an educated guess The study design used in the power analysis to calculate N (or MDE) may not align with that used in the actual study as the data may not meet the assumptions of the proposed method. i.e. the expected study design is an educated guess Therefore an a priori power analysis may not be accurate!! It’s purpose is to show the feasibility of the proposed study.
Resources UCLA Power Analysis Seminar: http://www.ats.ucla.edu/stat/seminars/intro_power/default.htm GPowerfree download &tutorial manual (Mac or PC): http://www.psycho.uni-duesseldorf.de/aap/projects/gpower/ Optimal Design for multilevel RCT (for PC): http://sitemaker.umich.edu/group-based/optimal_design_software Seminal reference for power analysis: Cohen, J. (1969) Statistical Power Analysis for the Behavioral Sciences. NY: Academic Press A Researcher’s Guide to Power Analysis, A. Hunt, USU