Download
1 / 1
10 likes | 106 Vues
Explore how human disturbances have influenced the trophic structure of the Lower Ohio River over time using stable isotopes. Studied trends in nitrogen and carbon ratios reveal ecological shifts related to channelization and dam construction.

E N D
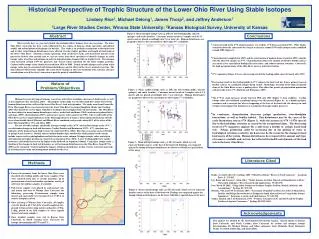
Historical Perspective of Trophic Structure of the Lower Ohio River Using Stable Isotopes Lindsey Rice1, Michael Delong1, James Thorp2, and Jeffrey Anderson1 1Large River Studies Center, Winona State University; 2Kansas Biological Survey, University of Kansas Figure 1. Mean nitrogen isotope ratio (+ 1SE) for fish feeding guilds, mussels (pelagic), and snails (benthic). Consumer means based on 5 samples each of 3-5 species and are placed accordingly into 5 year intervals. Human disturbances are graphed to observe the correlation or effect upon N15 availability. Abstract Conclusions Most recently have we seen and studied the profound effects humans have on ecosystems. The lower Ohio River ecosystem has been vastly influenced by the actions of humans (locks and dams, agricultural runoff, and urban/industrial discharge) for decades. This study is an in-depth examination to determine how and to what extent human disturbances have affected riverine trophic positions and length of food chain of the lower Ohio River. Museums contain specimens (fish, freshwater snails, and freshwater mussels) from present to historic time periods and we can use tissue from these specimens to identify changes in stable isotope ratios of carbon and nitrogen in order to help determine changes/shifts in trophic levels. The nitrogen ratio increased around 1970 for piscivores but stayed rather consistent for the other trophic positions. Carbon stable isotope ratios slowly decreased from 1920 to 2000. Trends in both nitrogen and carbon stable isotope ratios may be correlated with human disturbances and its effect on the river’s natural ecosystem. The data collected will not only conclude the extent of the changes in the ecosystem/food webs, but may also give consideration as to if the river’s ecosystem is past the point of rehabilitation. • A general trend in the δ15N of all consumers was evident. δ15N decreased from 1930 – 1960. Ratios remained about the same until they began to increase around 1970 until nitrogen ratios stabilized around 1980 (Figure 1). • Channelization (completed in 1929) and the construction of modern dams (started in 1955) coincide with the observed changes in δ15N. Channelization reduces the amount of effective benthic surface area in the river, especially in biologically active zones, and reduces nutrient retention. Conversely, the high navigation dams of the Ohio River increase nutrient retention. • δ13C signatures (Figure 2) have a decreasing trend in the feeding guilds, most obviously after 1955. • Decreasing trends in the feeding guilds in δ13C suggests the food web has from a primary base of benthic sources to a primarily pelagic-based system. Hydrologic retention of the high navigation dams of the Ohio River creates a pooling effect. This allows for greater phytoplankton production and generally lower δ13C (Richoux and Froneman, 2007). • The δ15N of snails increases greatly between 1960 and 1965 (Figure 3) then stabilizes. Carbon isotope ratios also exhibited a profound change over this period (Figure 4). As a benthic primary consumer and a surrogate for what is happening at the base of the food web, the changes in snail isotopic ratios support our hypothesis of a pronounced change trophic processes. • In conclusion, channelization decreases pelagic production, river-floodplain interactions, as well as benthic habitat. This disturbance may be the cause of the early fluctuations seen in δ15N (Figure 3), while the increase in δ15N (~1970) may be due to the hydrologic retention as caused by the navigational dams. The decreasing trend of δ13C signatures suggests the a shift from a benthic to pelagic based food web. Pelagic production could be increasing due to the pooling of water or hydrological retention created by the dams may be the reason for the change in basal food source of the system. Human disturbances have impacted the amount and types of resources available and, in turn, has reflected the health and dynamics of the food web in the lower Ohio River. Nature of Problem/Objectives Figure 2. Mean carbon isotope ratio (+ 1SE) for fish feeding guilds, mussels (pelagic), and snails (benthic). Consumer means based on 5 samples each of 3-5 species and are placed accordingly into 5 year intervals. Human disturbances are graphed to observe the correlation or effect upon C13 availability. Humans have greatly impacted many ecosystems with effects including a decrease in biodiversity, as well as the complexity (Fry and Allen, 2003). The purpose of this study was to understand how and to what extent human disturbances have affected the lower Ohio River’s food web dynamics. The study area (from Evansville, IN to Mississippi River) was chosen because the lower Ohio River has larger floodplain (Benke and Cushing, 2005) than that of the rest or upper Ohio River leading to more complex food web interactions. The Ohio River has been subject to many human disturbances such as wicket lock and dams (1885), modern navigational locks and dams (1955), channelization (1929), and invasive species (zebra mussels in 1993). The overall health of the Ohio River can have major influences on the Mississippi because it drains a large amount of discharge into the river (about double that of Missouri and Illinois River combined) and provides about 45% of the water of the lower Mississippi River (Fry and Allen, 2003). The use of stable isotopes, specifically nitrogen isotopic ratios (δ15N ) and carbon isotopic ratios (δ13C ), can determine changes in food web dynamics (Vander Zanden and Rasmussen, 1999). δ13C signatures are indicative of the primary basal food resource of a food web (Post, 2002). Riverine ecosystems can have benthic or pelagic basal resources. Benthic sources include benthic algae and detritus while pelagic based systems include sources such as phytoplankton and detritus in the water column. Nitrogen isotopic ratios can help in determination of trophic position in a food web an organism (Post, 2002). Lower feeding guilds have smaller δ15N values and should increase in the higher in the food web an organism is found. Using these isotope ratios, a timeline of the changes in food web dynamics, as well as human disturbances on the Ohio River, from 1875 to 2000 can be examined. Understanding the impacts of human disturbances on this riverine ecosystem may help in assisting conservation and management methods on the river. Figure 3. Mean nitrogen isotope ratio (+ 1 SE) for snails, which serve to represent benthic sources at the base of the food web. Findings are compared against the timing of human disturbances on the lower Ohio River (partial data set for now). Literature Cited Methods • Preserved specimens from the lower Ohio River were classified into feeding guilds and tissue samples (0.5g) were removed from fish at various museums, 1g of periostracum of snail and mollusc specimens, and 1g of soft tissue for mollusc samples, if available. • Fish tissue samples were placed in acid-washed vials and frozen and sent to Winona State University for laboratory processing. Periostracum samples from mussel and snail shells were be placed in 2 N HCL to remove inorganic carbon. • Once arriving at Winona State University, all samples were the dried at 60˚C for 48 hr or until completely dry, ground to fine powder using mortar and pestle or Wig-L-Bug, placed in tin (fish samples) or silver capsule (mussel and snails samples). • Once weighed, samples were sent to Kansas State University or North Carolina State University for isotopic determination of 15N and 13C . Benke, Art and Colbert E. Cushing. 2005. “Ohio River Basin.” Rivers of North America.” Academic Press. 9: 375-425. Fry, Brian and Yvonne C. Allen. 2003. “Stable Isotopes in Zebra Mussels as Bioindicators of River- Watershed Linkages.” River Research and Applications. 19: 683-696. Post, David M. 2002. “Using Stable Isotopes to Estimate Trophic Position: Models, Methods, and Assumptions.” Ecology 83: 703-718. Richoux, N.B. and P.W. Froneman. 2007. “Assessment of Spatial Variation in Carbon Utilization by Benthic and Pelagic Invertebrates in Temperate South African Estuary Using Stable Isotope Signatures.” Estuarine, Coastal, and Shelf Science. 71: 545-558. Vander Zanden and J. B. Rasmussen. 1999. “Primary Consumer δ13C and δ15N and the Trophic Position of Aquatic Consumers.” Ecology 80:1395-1404. Figure 4. Mean carbon isotope ratio (+ 1 SE) for snails, which serve to represent benthic sources at the base of the food web. Findings are compared against the timing of human disturbances on the lower Ohio River (partial data set for now). Acknowledgements This project was funded by the Environmental Protection Agency. Special thanks to Kansas State University and North Carolina State University for carbon and nitrogen isotopic determination, Dr. Michael Delong, and fellow colleagues Leah McIntosh, Katie Delahanty, Danny Crawford, Emily Eng, and Aaron Hefty.