Download
1 / 57
590 likes | 702 Vues
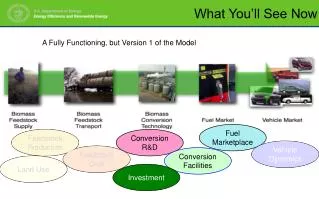
What You’ll See Now. A Fully Functioning, but Version 1 of the Model. Fuel Marketplace. Feedstock Production. Conversion R&D. Vehicle Dynamics. Feedstock Cost. Conversion Facilities. Land Use. Investment. Increase In Ag Output. Marketplace Fuel Market. Prevailing Value.

E N D
What You’ll See Now A Fully Functioning, but Version 1 of the Model Fuel Marketplace Feedstock Production Conversion R&D Vehicle Dynamics Feedstock Cost Conversion Facilities Land Use Investment
Increase In Ag Output Marketplace Fuel Market Prevailing Value Marketplace Corn EtOH Price R&D Applied Fundamentals Corn Price Detail Feedstock Price Detail EtOH Price Detail R&D Yield Corn EtOH Capacity Corn EtOH Price Attractiveness To Build Cost Growth Corn Price R&D: Piloting Detail Detail Total Biomass Production & Residue Collection Detail Attractiveness R&D Yield Effort Ratio & Cost Growth Plant Addition Logic Effort Ratio Potential EtOH Demand from Fuel Usage Industrial Capacity Detail Detail Output Capacity Output Capacity Detail Plant Additions Escalated Capital Cost Required Rate of Return Ave Yield On-line #In D&S #In Start-up #On-line Detail Detail Capital Cost Output Capacity & Ave Yield Capacity &Ave. Yield Equity ROI Plant Pipeline Operating Experience Cost of Capital & Taxes Expected Plant Performance Detail Output Capacity Ave On-line Yield #On-line Learning Curve Logic Detail Cost of Capital & Taxes Detail Learning Curve Logic Conversion Yield Detail END
Fundamental R&D Maximum Required Effort $500MM R & D Yield Accumulated R&D Investment Max Required Effort Effort Ratio = As the effort is increased (with appropriate dampeners and dissipation) the R&D yield (gal/ton) is increased on a curve from 50% to 100% of maximum. Effectiveness of spending is influenced by $/yr Similarly the Capital Cost Growth is Lowered as a result of increased effort Maximum Mature Technology Yield Maximum Effective Annual Spending R & D Capital Cost Growth Factor Fundamental R&D - 1 Investment Profile & Initial Load MM$/year Intro Return Forward
Fundamental R&D Yield Factor Maximum Required Effort $500MM Fundamental R&D - 2 R & D Yield R&D Investment Max Effort Req Accumulated R&D Investment Max Required Effort Effort Ratio = As the effort is increased (with appropriate dampeners and dissipation) the R&D yield (gal/ton) is increased on a curve from 50% to 100% of maximum. Yield = Factor x Max Yield Possible Effectiveness of spending is influenced by $/yr Similarly the Capital Cost Growth is Lowered as a result of increased effort Maximum Mature Technology Yield Maximum Effective Annual Spending R & D Capital Cost Growth Factor Investment Profile & Initial Load MM$/year Return Forward
Fundamental R&D Maximum Required Effort $500MM R & D Yield Accumulated R&D Investment Max Required Effort Effort Ratio = As the effort is increased (with appropriate dampeners and dissipation) the R&D yield (gal/ton) is increased on a curve from 50% to 100% of maximum. Effectiveness of spending is influenced by $/yr Similarly the Capital Cost Growth is Lowered as a result of increased effort Cap Cost Growth is multiplier on Cap Cost Maximum Mature Technology Yield Maximum Effective Annual Spending R & D Capital Cost Growth Factor Fundamental R&D - 3 Investment Profile & Initial Load MM$/year Return Forward
Illustration of Impact on Yield and Capital Cost Growth of Research Spending Fundamental R&D - 4 R&D Spending increases in 2 Research Tracks to a Maximum Of $500MM R&D Yield is Increased Track 1 reaches its expected Maximum of 50 gal/ton Track 2 continues to increase toward its Maximum of 105 gal/ton Capital Cost Growth Factor is Reduced END Return
Actual STELLA Module Flowsheet Fundamental R&D - 5 END Return
Pilot R&D Maximum Required Effort $250MM R & D Yield • Build on the R&D Yield and Capital Cost Growth Accomplished in Fundamental R&D • Utilize similar logic of funding drives improvements, but can be dampened and dissipated • Result is: • R&D Yield after Piloting • R&D Capital Cost Growth Factor after Piloting R & D Yield Pilot Effort Ratio R&D Capital Cost Growth Factor R&D Capital Cost Growth Factor Investment Profile & Initial Load MM$/year Pilot R&D - 6 Intro Return Forward
Pilot R&D Pilot R&D - 7 Maximum Required Effort $250MM R & D Yield Acc Pilot R&D Investment Max Required Effort Pilot Effort Ratio = • Convert the Pilot Effort Ratio into an “S” type learning curve. • Piloting will reduce Capital Cost Growth by a maximum of 0.785 from 2.04 - 1.61 to 1.6 – 1.26 based on “S” ratio • Cap Cost Growth = Cap Cost Growth-R&D x [1 – (0.215 x “S” ratio)] R & D Yield Pilot Effort Ratio R&D Capital Cost Growth Factor R&D Capital Cost Growth Factor Investment Profile & Initial Load MM$/year Return Forward
Pilot R&D Maximum Required Effort $250MM R & D Yield Acc Pilot R&D Investment Max Required Effort Pilot Effort Ratio = • Piloting enables Yield to approach Fundamental R&D Yield • Without Piloting - R&D Yield is 50% of Fund R&D Yield • Yield Reduction is minimized by Pilot Effort – “S” Ratio • R&D Yield = R&D Yield x Impact of Pilot Effort R & D Yield Pilot Effort Ratio R&D Capital Cost Growth Factor R&D Capital Cost Growth Factor Investment Profile & Initial Load MM$/year Pilot R&D - 8 END Return
Actual STELLA Module Flowsheet Pilot R&D - 9 END Return
Calculating Escalated Capital Cost Co-Location Reductions EtOH Output Capacity Determine the “Real” Capital Cost for Demo, Pioneer and Full-scale Facilities Utilize experience at previous scale (e.g., pilot for Demo), R&D Capital Cost Growth and total industry size Allow reductions in capital cost for co-location of Demo plants with existing corn mills Accumulated Operating Experience Escalated Capital Cost Pilot Effort Ratio & R&D Capital Cost Growth Factor Calculating Escalated Capital Cost - 1 Debt Investor Multiplier Total Plant Investment & Fraction Debt Financing Intro Return Forward
Years Growth Cap Growth Full Scale Accumulated years of Experience at Pioneer Scale Ratio Growth Cap Growth Demo Pilot Effort Ratio Calculating Escalated Capital Cost Co-Location Reductions Calculating Escalated Capital Cost - 2 EtOH Output Capacity • Determine the Debt Investor Capital Growth Factor for • Various scale-up • Demo – 1 to 2 growth factor based on Pilot Effort Ratio • Pioneer – 1 to 2 growth factor based on Accumulated Operating Experience at the Demo Scale up to 1 yr • Full Scale - 1 to 2 growth factor based on Accumulated Operating Experience at the Pioneer Scale up to 1 yr • All times the Debt Investor Multiplier Accumulated Operating Experience Escalated Capital Cost Pilot Effort Ratio & R&D Capital Cost Growth Factor Debt Investor Multiplier Total Plant Investment & Fraction Debt Financing Return Forward
500MM Gal/yr Industry Experience Factor Industrial Capacity Billions of Gal per yr Calculating Escalated Capital Cost Co-Location Reductions EtOH Output Capacity Finalize Capital Cost Growth Factor = Industry Experience Factor (see graph) x R&D Cost Growth Factor (~1.2 to 2) x Equity Frac + Debt Investor Cost Growth (~1.25 to 2.5) x Debt Frac IndExp x (R&DCapGrowth x Equity + DebtCapGrowth x Debt ) + 1 - IndExp Accumulated Operating Experience Escalated Capital Cost Pilot Effort Ratio & R&D Capital Cost Growth Factor Calculating Escalated Capital Cost - 3 Debt Investor Cost Growth Total Plant Investment & Fraction Debt Financing Return Forward
Calculating Escalated Capital Cost Co-Location Reductions Calculating Escalated Capital Cost - 4 EtOH Output Capacity Escalated Capital Cost is then Cost Growth x User Input Capital Cost for each scale plant Allowances for Capital Reduction for Demo (75% for 5MM gal/yr) and Pioneer (50% for 50MM gal/yr) for co-location or reduced “Greenfield” Accumulated Operating Experience Escalated Capital Cost Pilot Effort Ratio & R&D Capital Cost Growth Factor Debt Investor Multiplier Total Plant Investment & Fraction Debt Financing END Return
Actual STELLA Module Flowsheet Calculating Escalated Capital Cost - 5 END Return
Calculating Required Rate of Return Investor Type Willingness to Skip from Demo to Full Scale Equity Required Rate of Return EtOH Output Capacity Utilize Prior Scale Experience & Investor Type (Conservative to Aggressive) Along with a Mature Industry Rate of Return and New Industry Risk Factor To Determine the Required Rate of Return Accumulated Operating Experience Pilot Effort Ratio Calculating Required Rate of Return - 6 Equity Mature Rate of Return Net (with Debt) Req Rate of Return New Industry Risk Factor Intro Return Forward Debt Fraction & Debt Interest Rate
e.g. Aggressive Investor Calculating Required Rate of Return Risk for Demo Investor Type Willingness to Skip from Demo to Full Scale Equity Required Rate of Return Pilot Effort Ratio Calculating Required Rate of Return - 7 EtOH Output Capacity e.g. Moderate Investor • Prior Scale Experience Risk Factor (dependent on investor) • Use Pilot Effort Ratio for Demo • Use years of experience at Demo Scale for Pioneer Scale • Use years of experience at Pioneer Scale for Full Scale • Or years of experience at demo for Full Scale if skipping • Pioneer Risk for Pioneer Accumulated Operating Experience Years at Demo Accumulated Op Exp Pilot Effort Ratio e.g. Conservative Investor Equity Mature Rate of Return Net (with Debt) Req Rate of Return Risk for Full Scale New Industry Risk Factor Return Forward Debt Fraction & Debt Interest Rate Years at Pioneer Accumulated Op Exp
Conservative Investor Industry Experience Risk Factor Calculating Required Rate of Return Investor Type Willingness to Skip from Demo to Full Scale Equity Required Rate of Return Industrial EtOH Capacity EtOH Output Capacity Moderate Investor Overall Industrial Experience Risk Factor Use Output Capacity & Investor Type for all Scales Accumulated Operating Experience Pilot Effort Ratio Aggressive Investor Calculating Required Rate of Return - 8 Equity Mature Rate of Return Net (with Debt) Req Rate of Return New Industry Risk Factor Return Forward Debt Fraction & Debt Interest Rate
Calculating Required Rate of Return Investor Type Willingness to Skip from Demo to Full Scale Equity Required Rate of Return Calculating Required Rate of Return - 9 EtOH Output Capacity • New Industry Rate of Return (ROR) = • Mature Rate (e.g., 10%) x • New Industry Risk (e.g., 3) x Prior Scale Risk (2 for none, 1 for high exp) • Range from 10 to 60% • Final Equity Rate of Return = • New Industry ROR x Industry Exp Risk (1 for none, 0 for high exp) • + (1 - Ind Exp Risk) x Mature ROR • Range from 60% with no industry experience & no scale experience down to 10% Accumulated Operating Experience Pilot Effort Ratio Equity Mature Rate of Return Net (with Debt) Req Rate of Return New Industry Risk Factor Return Forward Debt Fraction & Debt Interest Rate
Calculating Required Rate of Return Investor Type Willingness to Skip from Demo to Full Scale Equity Required Rate of Return EtOH Output Capacity Venture Capital Utilization for Demonstration Pilot Effort Ratio > 0.95 Full Scale EtOH Production Price < Prevailing Gasoline Price Industry Output < 20 MM gal/yr If the above Criteria is met then demonstration will be done with Venture Capital at 2% Hurdle Rate Accumulated Operating Experience Pilot Effort Ratio Calculating Required Rate of Return - 10 Equity Mature Rate of Return Net (with Debt) Req Rate of Return New Industry Risk Factor END Return Debt Fraction & Debt Interest Rate
Actual STELLA Module Flowsheet Calculating Required Rate of Return - 11 END Return
Calculating Cost of Capital and Taxes Plant Life Time for Design, Const & Startup Annual Loan Payment Escalated Capital Cost Utilize standard financial calculations to calculate: Capital Recovery Factor Annual Return Before and After Taxes Annual Loan Payment All are combined in one term Cost of Capital+Taxes+Loan / Gallon of Capacity Equity Rate of Return EtOH Output Capacity Calculating Cost of Capital and Taxes - 12 Tax Rate Cost of Capital And Taxes Debt Fraction & Debt Interest Rate Intro Return Forward
Example of Cost of Capital for Different Scale Plants over Time Calculating Cost of Capital and Taxes - 13 Venture Capital Ends for Demo due to Industry Volume Venture Capital Starts for Demo End Return
Actual STELLA Module Flowsheet Calculating Cost of Capital and Taxes - 14 END Return
Calculating Expected Plant Performance Mature Plant Design Feed Rate Average Online Yield Purpose is to Calculate the plant EtOH production capacity Plants are designed on Feedstock Rates Use Maximum of; Installed Yield or 90% of R&D Yield Influenced by Overall Experience in the Industry (installed capacity) – “Learning Curve” Net effect is a reduction in the capacity until 600MM gal have been installed EtOH Plant Capacity R&D Max Yield EtOH Installed Capacity Calculating Expected Plant Performance -1 Intro Return Forward
Calculating Expected Plant Performance Experience Impact on % Capacity Mature Plant Design Feed Rate 600MM Gallons/y Industry Capacity Billions of Gallons Calculating Expected Plant Performance -2 Average Online Yield Purpose is to Calculate the plant EtOH production capacity Plants are designed on Feedstock Rates Maximum of Installed Yield or 90% of R&D Yield Influenced by Overall Experience in the Industry (installed capacity) – “Learning Curve” Yield is constrained until 600MM gal have been installed EtOH Plant Capacity R&D Max Yield EtOH Installed Capacity Return Forward
Calculating Expected Plant Performance Theoretical – No Plant Construction - Uneconomical Mature Plant Design Feed Rate Average Online Yield Purpose is to Calculate the plant EtOH production capacity Plants are designed on Feedstock Rates Maximum of Installed Yield or 90% of R&D Yield Influenced by Overall Experience in the Industry (installed capacity) – “Learning Curve” Yield is constrained until 600MM gal have been installed EtOH Plant Capacity R&D Max Yield EtOH Installed Capacity Calculating Expected Plant Performance -3 END Return
Actual STELLA Module Flowsheet Calculating Expected Plant Performance -4 END Return
Marketplace – Fuel Market EtOH Output Capacity Gasoline Price Various Oil Price Projections Utilizing various future oil price projections (AEO & User) Convert the price of oil into a price of gasoline Gasoline Price ($/gal) = Oil Price x 1.175 + 0.187 At low volumes, EtOH has a enhanced value because of its properties (e.g., octane, as an oxygenate, etc.) Prevailing Price ($/gal) = Gasoline Price x EtOH Relative Value Oil to Gasoline Conversion Gasoline Fixed Costs Prevailing Price Marketplace – Fuel Market -9 EtOH to Gasoline Value Ratio Intro Return Forward
Marketplace – Fuel Market EtOH Output Capacity Gasoline Price Marketplace – Fuel Market -10 Various Oil Price Projections Utilizing various future oil price projections (AEO & User) Convert the price of oil into a price of gasoline Gasoline Price ($/gal) = Oil Price x 1.175 + 0.187 At low volumes, EtOH has a enhanced value for octane, as an oxygenate, etc. Prevailing Price ($/gal) = Gasoline Price x EtOH Relative Value Oil to Gasoline Conversion Gasoline Fixed Costs Prevailing Price EtOH to Gasoline Value Ratio Return Forward
Marketplace – Fuel Market EtOH Output Capacity Gasoline Price Various Oil Price Projections Utilizing various future oil price projections (AEO & User) Convert the price of oil into a price of gasoline Gasoline Price ($/gal) = Oil Price x 1.175 + 0.187 At low volumes, EtOH has a enhanced value for octane, as an oxygenate, etc. Prevailing Price ($/gal) = Gasoline Price x EtOH Relative Value Oil to Gasoline Conversion Gasoline Fixed Costs Prevailing Price Marketplace – Fuel Market -11 EtOH to Gasoline Value Ratio END Return
Actual STELLA Module Flowsheet Marketplace – Fuel Market -12 END Return
Marketplace – Corn Ethanol Price Prevailing Price EtOH Price (Cellulosic) Corn EtOH Price Corn Price Corn EtOH price is calculated based on specified capital, operating, and corn, and DDG costs minus the subsidy. An “Attractiveness” based on the competing prices of EtOH and gasoline is calculated The “Attractiveness” is used along with “Max growth Rate” to determine the corn EtOH growth and Total Capacity Corn EtOH production DDG Price & Rate of Change Corn EtOH Capacity Maximum Corn EtOH Growth Rate & Ultimate Capacity Mature Plant Return on Equity Corn Ethanol Subsidy Marketplace – Corn Ethanol Price -4 New Plant Capital Cost, Operating Cost & Tax Rate Corn Ethanol Plant Life Conversion Yield Intro Return Forward
Prevailing Price Marketplace – Corn Ethanol Price EtOH Output Capacity EtOH Price (Cellulosic) Corn EtOH Price Marketplace – Corn Ethanol Price -5 Corn Price • Corn EtOH Price • Plant Capital Cost (~1.30 $/gal) & ROI (10%) • Taxes (39%) • Operating Costs (35¢/gal) • DDG Price (29¢/gal EtOH decreasing with volume 0.006¢/MM gal) • EtOH yield per bushel (2.8 to 3.0 gal/bu) • EtOH Subsidy (50¢/gal until 2020) • Corn Price – dynamically calculated DDG Price & Rate of Change Corn EtOH Capacity Maximum Corn EtOH Growth Rate & Ultimate Capacity Mature Plant Return on Equity 2020 Corn Ethanol Subsidy Yield Gal/bu Prevailing Price 2010 New Plant Capital Cost, Operating Cost & Tax Rate Corn Ethanol Plant Life Year Conversion Yield Return Forward
Prevailing Price Marketplace – Corn Ethanol Price EtOH Output Capacity EtOH Price (Cellulosic) Corn EtOH Price Corn Price • Corn EtOH “Attractiveness” drive Industry Growth • Function Related to the Ratio of Corn EtOH price to lower of Cellulosic EtOH or Gasoline • Ratio of 1 Attractiveness is 1 • Ratio < 1 Attractiveness > 1 DDG Price & Rate of Change Corn EtOH Capacity Corn EtOH Price Cellulosic EtOH or Gasoline Price Maximum Corn EtOH Growth Rate & Ultimate Capacity Mature Plant Return on Equity Corn Ethanol Subsidy Marketplace – Corn Ethanol Price -6 Corn EtOH Plant Attractiveness New Plant Capital Cost, Operating Cost & Tax Rate Corn Ethanol Plant Life Corn EtOH Price Cellulosic EtOH or Gasoline Conversion Yield Forward Return
Prevailing Price Marketplace – Corn Ethanol Price EtOH Output Capacity EtOH Price (Cellulosic) Corn EtOH Price Marketplace – Corn Ethanol Price -7 Corn Price Corn EtOH Capacity “Attractiveness” (1 to 2 scale) is converted into a frac growth rate Max Growth Rate is set at 20% Actual Growth Rate is FRAC x MAX Rate As long as the Industry Capacity is less than the Maximum Allowable, set at 30 billion gal/yr MAX DDG Price & Rate of Change Corn EtOH Capacity Maximum Corn EtOH Growth Rate & Ultimate Capacity Mature Plant Return on Equity Corn Ethanol Subsidy FRAC of MAX Growth Rate New Plant Capital Cost, Operating Cost & Tax Rate Corn Ethanol Plant Life . Attractiveness . Conversion Yield END Return
Actual STELLA Module Flowsheet Marketplace – Corn Ethanol Price -8 END Return
Industrial Capacity Detail Plants Online & Starting up Corn EtOH Capacity Industry EtOH Output Cellulosic and Total • Utilizing the number of Plant online and starting-up, their feed capacity, average online yield and utilization (startup are considered running at 50%) • Industry Output in gallons is Calculated • Feedstock Requirements are Calculated • If Feedstock Available is less than Plant Requirements • EtOH is reduced to match Feedstock • Total EtOH is then the Sum of Corn EtOH and Cellulosic EtOH Biomass (inc Residue) Production Cellulosic EtOH Capacity OnLine Yield Start-up Utilization Factor Cellulosic Feedstock Demand Industrial Capacity Detail -10 Mature Plant Feedstock Demand END Return
Actual STELLA Module Flowsheet Industrial Capacity Detail -11 END Return
Plant Pipeline: Track Number of Plants & Yields Plants Additions Subsidized & Unsubsidized Conversion Yield Accumulated Years Of Operating Experience • Given the number of new plant starts demanded, the time for design & construction and time for start-up • The number of plants (demo, Pioneer, Full Scale) in each phase (D&S, Start-up, Online) are determined • Utilizing a Learning Curve Logic – On-line yield is increased Learning Curve Logic Average Online Conversion Yield Plant Pipeline: Track Number of Plants & Yields -5 Design & Construction Time Number of Plants Online, In Start-up, In Design Start-up Time END Return
Actual STELLA Module Flowsheet Plant Pipeline: Track Number of Plants & Yields -6 END Return
Plant Addition Logic Investment Attractiveness With Cap. Subsidy Investment Attractiveness w/o Cap. Subsidy Total Plants in D&S, Start-up and Online Total EtOH Output (Capacity) • Investment Attractiveness (1 to 2) is converted to a fraction (0 to 1) • Market Attractiveness is a function of Current Capacity/Demand • Attractiveness Frac & Market are used to adjust Max Growth Rate (25%) • Smaller of Growth Rate x # Existing Plants or 30 becomes the number of new plants started per year • As the industry grows to 1 billion gallons the need for Govt Subsidized Plants is eliminated Potential EtOH Demand Number of New Plants to Build Maximum Growth Rate Max New Plants Per Year Plant Addition Logic -20 Max New Plants Subsidized Forward Intro Return
. Market Attractiveness . EtOH Capacity/EtOH Demand . Investment Attractiveness Fraction Investment Attractiveness Plant Addition Logic Investment Attractiveness With Cap. Subsidy Investment Attractiveness w/o Cap. Subsidy Plant Addition Logic -21 Total Plants in D&S, Start-up and Online Total EtOH Output (Capacity) • Investment Attractiveness (1 to 2) is converted to a fraction (0 to 1) • Market Attractiveness is a function of Current Capacity/Demand • Attractiveness Frac & Market are used to adjust Max Growth Rate (25%) • Smaller of Growth Rate x # Existing Plants or 30 becomes the number of new plants started per year • As the industry grows to 1 billion gallons the need for Govt Subsidized Plants is eliminated Potential EtOH Demand Number of New Plants to Build Maximum Growth Rate Max New Plants Per Year Max New Plants Subsidized END Return
Actual STELLA Module Flowsheet Plant Addition Logic -22 END Return
Learning Curve Total Plants Online Online Yield • The Rate of Doubling x Technology Gap x Progress Ratio (0.8) is an “S” type learning curve • Technology Gap is [Max Yield – Online Yield] • Learning Curve Logic is used to improve the online yield Total EtOH Output (Capacity) Learning Curve Logic ‘Online Yield Improvement’ Progress Ratio Max Technology Yield Learning Curve -7 Intro Return Forward
Learning Curve Learning Curve -8 Total Plants Online Online Yield • The Rate of Doubling x Technology Gap x Progress Ratio (0.8) is an “S” type learning curve • Technology Gap is [Max Yield – Online Yield] • Learning Curve Logic is used to improve the online yield Total EtOH Output (Capacity) Learning Curve Logic ‘Online Yield Improvement’ Progress Ratio Max Technology Yield END Return
Actual STELLA Module Flowsheet Learning Curve -9 END Return
Investment Attractiveness Feedstock Price Conversion Yield Cost of Capital & Taxes Gasoline Price • Calculate the cost of Cellulosic Production, including return on investment • If there is an RFS – Compare to Corn EtOH Price otherwise compare to Gasoline Price • Convert ratio of prices to “Attractiveness Factor” • For Govt Capital Subsidy – Appropriately lower the Capital Requirement according to the levels of money available Corn EtOH Price Attractiveness To Build “Factor” Subsidies on EtOH Production Investment Attractiveness -15 Cost of Production & By-Product Credits Government Capital Subsidies Intro Return Forward
Investment Attractiveness Feedstock Price “Attractiveness” . Conversion Yield Investment Attractiveness -16 Cost of Capital & Taxes Cellulose EtOH Price Corn EtOH Price Gasoline Price • Calculate the cost of Cellulosic Production, including return on investment • If there is an RFS – Compare to Corn EtOH Price otherwise compare to Gasoline Price • Convert ratio of prices to “Attractiveness Factor” • For Govt Capital Subsidy – Appropriately lower the Capital Requirement according to the levels of money available Corn EtOH Price Attractiveness To Build “Factor” Subsidies on EtOH Production “Attractiveness” . Cost of Production & By-Product Credits Government Capital Subsidies Cellulose EtOH Price Gasoline Price Return Forward