Library Statistics for Effective Resource Allocation and Strategic Development
This presentation on library statistics delves into the importance of data collection for resource allocation and strategic development. Various topics covered include gap analysis, benchmarking, key performance indicators, and efficiency evaluation methodologies. Learn how to utilize statistics to demonstrate the need for resources and showcase the impact of changes in library services. The focus is on optimizing library performance and enhancing user experience through data-driven decision-making.


Library Statistics for Effective Resource Allocation and Strategic Development
E N D
Presentation Transcript
Library Statistics: what’s needed and what’s newLynn CopelandSimon Fraser University LibraryThurs. March 15, 2007Vancouver Ass’n of Law Libraries
Why collect them? • How to allocate resources most effectively • Demonstrate need for resources • Demonstrate impact of change • Tell our story Library Statistics VALL March 15, 2007
Why to NOT collect them? • Cost vs benefit • Protection of Privacy • Redundancy • Lack of validity Library Statistics VALL March 15, 2007
What to collect • ie – What are the questions we want to answer • How are we doing? – compared to goals • How are we doing? – peer comparison • How are we doing? – past comparison Library Statistics VALL March 15, 2007
Outcomes vs inputs Library Statistics VALL March 15, 2007
Gap analysis • Through surveys, attempt to determine difference between expected, perceived services and service levels Library Statistics VALL March 15, 2007
Conjoint analysis • First, detailed service model for several different possible new services developed • Surveys are based on a number of different questions for each service • Consistently positive results show which are most important to viewers Library Statistics VALL March 15, 2007
Gap analysis eg (2001) Library Statistics VALL March 15, 2007
Undergrad 2003 Library Statistics VALL March 15, 2007
Faculty 2003 Library Statistics VALL March 15, 2007
Journal needs/met 2001-03 Library Statistics VALL March 15, 2007
Libqual+ • Type of gap analysis • Desired, perceived and minimum evaluations • Calculates zone of tolerance • Identify services outside the zone Library Statistics VALL March 15, 2007
Balanced Scorecard • Finances • Users • Internal processes • Improvement activities Library Statistics VALL March 15, 2007
Key Performance Indicators • appropriate to the mission and working conditions • informative as to problems and shortcomings • demonstrating effectiveness, efficiency and outcome of library services to the funding institutions and the public, • practical and easy-to-use • provide a rounded picture Library Statistics VALL March 15, 2007
Benchmarking • Comparison and review against best • Identify and implement best possible • Often ‘soft’ comparisons Library Statistics VALL March 15, 2007
Benchmarking indicators should • mirror the full extent of library services, • consider electronic as well as traditional services, • help to demonstrate the importance and impact of libraries, • yield results that are easily understandable • a few measures that should preferably be collected from normal library statistics. • allow for special conditions in the libraries Library Statistics VALL March 15, 2007
Library activities/op. budg. 2004-05 (SFU=1) Library Statistics VALL March 15, 2007
IndicatorA. Resources, infrastructure: What services does the library offer? • Library as place for learning and research • User area in m2 per capita - Study place hours per week per user • Workstation hours per capita - Opening hours per week • Opening hours compared to demand • Collection • Expenditure per capita - Expenditure per user • Expenditure to total expenditure • Expenditure on serials to total collection expenditure • Materials per capita - Books added per year per capita • Serial subscriptions per capita - Renewal rate • Availability of required titles - ILL items delivered to items received • Immediate media availability • User training - Training lessons per capita • Staff - Staff per capita Library Statistics VALL March 15, 2007
IndicatorB. Usage: How are services used/accepted? • Market penetration - by remote E-services - User satisfaction • Library as place for learning and research • Visits per capita - Visits per opening hour • Collection • Collection use/turnover • Loans in the past year / acquisitions over the past 5 years • Loans per capita - Loans per user • Sessions per capita - OPAC sessions per capita • Downloads (average) per E-journal - Proportion of ILL loans to total loans • Information services • Attendance at training lessons per capita • Information requests per capita • Events - Attendances at events per capita Library Statistics VALL March 15, 2007
Indicator C. Efficiency: Are the services offered cost-effectively? General- Cost per user - Cost per visit Collection - Acquisitions budget per loan - Acquisitions expenditure to staff costs Staff - User services staff as percentage of total - Employee hours per opening hour - Expenditure on staff per user Processes - speed - Acquisition speed - Media processing speed - Employee productivity in media processing - Document delivery time - Interlibrary loan speed Processes - reliability - Shelving accuracy - Percentage of successful ILL requests Library Statistics VALL March 15, 2007
IndicatorD. Development / potentials: Sufficient potential for future development? • Electronic services: • Percentage spent on the electronic collection • Percentage of library staff providing electronic services • Staff development and motivation - Hours/days of training per staff member - Expenditure per staff member • Rate of employee availability - Employee fluctuation rate • Budget • Percentage received by special grants or income generated • Percentage of institutional means allocated to the library Library Statistics VALL March 15, 2007
A Story… • For the Board of Governors, as part of a package to explain the MacLeans numbers Library Statistics VALL March 15, 2007
Library Holdings Per Student SFU Library Holdings per student are low; historically, the collection has been inadequately supported. Library Statistics VALL March 15, 2007
Library Expenses as a Percentage of Operating Budget This is being rectified by healthy Library operating expenditures as a percentage of the University’s operating budget. Library Statistics VALL March 15, 2007
Acquisitions as a Percentage of Library Budget The Library’s relatively high expenditures in acquisitions (print and electronic) is leading to an improvement in the historically inadequate collection Library Statistics VALL March 15, 2007
Library Activities (2003/04) SFU Library’s other expenditures are providing greater support for students in: • Instruction • Reference (online, in person) • Book loans • Electronic journals Library Statistics VALL March 15, 2007
Another Story… • For the Board of Governors Library Statistics VALL March 15, 2007
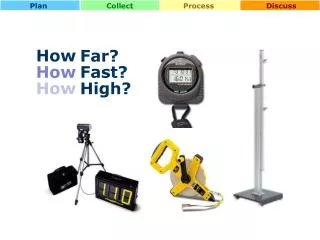
How are we doing? Library Statistics VALL March 15, 2007
How are we doing? Library Statistics VALL March 15, 2007
How are we doing? Library Statistics VALL March 15, 2007
Other • Counter/Sushi • UK Serials group usage factor study • Conjoint analysis Library Statistics VALL March 15, 2007
Questions? Thanks Lynn Copeland copeland@sfu.ca Library Statistics VALL March 15, 2007


![[PDF] Dumpling Cats: Crochet and Collect Them All! Android](https://cdn7.slideserve.com/12435080/slide1-dt.jpg)