Download
1 / 29
410 likes | 1.67k Vues
EPI-546 Block I. Lecture 3: Frequency How do we measure disease, define risks, and then make use of this information?. Mathew J. Reeves BVSc, PhD Associate Professor, Epidemiology. Objectives - Concepts. 1. Understand the concept of uncertainty, probability and odds

E N D
EPI-546 Block I Lecture 3: FrequencyHow do we measure disease, define risks, and then make use of this information? Mathew J. Reeves BVSc, PhD Associate Professor, Epidemiology Mathew J. Reeves, Dept. of Epidemiology, Mich State Univ.
Objectives - Concepts • 1. Understand the concept of uncertainty, probability and odds • 2. Measures of disease frequency • Prevalence • Incidence • Cumulative incidence • Incidence density (the concept of person-time) • 3. Relationship between incidence, duration & prevalence • 4. Risk estimates and their uses Mathew J. Reeves, Dept. of Epidemiology, Mich State Univ.
Objectives - Skills • 1. Convert probability to odds and vice versa • 2. Define, calculate and interpret prevalence, cumulative incidence, and incidence density • 3. Define, calculate and interpret “risk estimates” • RR, RRR, ARR, NNT, OR, PAR, PARF Mathew J. Reeves, Dept. of Epidemiology, Mich State Univ.
Measuring Disease and Defining Risks • Clinicians are required to know or make estimates of many things: • The occurrence of disease in a population • The “risk” of developing a disease or an outcome (prognosis) • The risks and benefits of a proposed treatment • This skill requires an understanding of: • Measures of disease frequency • Proportions and odds • Prevalence and incidence rates • Risk (relative and absolute) Mathew J. Reeves, Dept. of Epidemiology, Mich State Univ.
Uncertainty • Medicine isn’t an exact science, uncertainty is ever present • Uncertainty can be expressed either: • Qualitatively using terms like ‘probable’, ‘possible’, ‘unlikely’ • Study: Docs asked to assign prob. to commonly used words: • ‘Consistent with’ ranged from 0.18-0.98 • ‘Unlikely’ ranged from 0.01 to 0.93 • Quantitatively using probabilities (P) • Advantage: explicit interpretation, exactness • Disadvantage: may force one to be more exact that is justified! Mathew J. Reeves, Dept. of Epidemiology, Mich State Univ.
Probability vs. Odds Probability (P) or “risk” of having an event Odds = ratio of the probability of having an event to the probability of not having the event or P / (1 – P) • P = 1/5 = 0.2 or 20% • Odds = (P) / (1-P) • Odds = 0.2 / 0.8 or 1:4or “one to four” Example: 1 out of 5 patients suffer a stroke……. Mathew J. Reeves, Dept. of Epidemiology, Mich State Univ.
Relationship between Prob. and odds Probability and odds are more alike the lower the absolute P (risk) • Prob = Odds/1 + Odds • Odds = Prob/1 – Prob • Example: Prob = 2/[1 + 2] Prob = 2/3 = 0.67 Odds= 0.67/[1-0.67] Odds= 0.67/0.33 = 2 Mathew J. Reeves, Dept. of Epidemiology, Mich State Univ.
Measures of disease frequency - Prevalence Defn: the proportion of a defined group or population that has a clinical condition or outcome at a given point in time • Prev = Number of cases observed at time t Total number of individuals at time t • ranges from 0 to 1 (it’s a proportion), but usually referred to as a rate and is often shown as a % • Example: • Of 100 patients hospitalized with stroke, 18 had ICH • Prevalence of ICH among hospitalized stroke patients = 18% • The prevalence rate answers the question: • “what fraction of the group is affected at this moment in time?” Mathew J. Reeves, Dept. of Epidemiology, Mich State Univ.
Measures of disease frequency – Incidence Rates • A special type of proportion that includes a specific time period and population-at-risk • Numerator = the number of newly affected individuals occurring over a specified time period • Denominator = the population-at-risk over the same time period • There are two types of incidence rates…….. Mathew J. Reeves, Dept. of Epidemiology, Mich State Univ.
Cumulative Incidence Rate (CIR) Defn: the proportion of a defined at-risk group or population that develops a new clinical condition or outcome over a given time period. • CIR= Num. of newly disease indv. for a specific time period Total number of population-at-risk for same time period • Measures the proportion of at-risk individuals who develop a condition or outcome over a specified time period • Ranges from 0 to 1 (so it’s a proportion!) but called a rate because it includes time period and population-at-risk • Must be accompanied by a specified time period to be interpretable - because the CIR must increase with time • 7-day CIR of stroke following TIA = 5% • 90-day CIR of stroke following TIA = 10% Mathew J. Reeves, Dept. of Epidemiology, Mich State Univ.
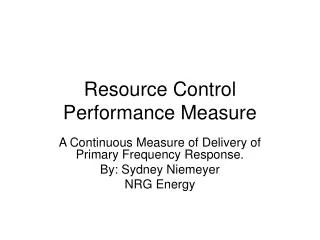
Cumulative Incidence of GI side effects for Rofecoxib (VIOXX) vs. Naproxen - The VIGOR Trial (Bombardier NEJM 2000) Mathew J. Reeves, Dept. of Epidemiology, Mich State Univ.
Cumulative Incidence Rate (CIR) • A measure of “average risk” • CIR answers the question: “what is the probability or chance that an individual develops the outcome over time” • Also referred to as the “risk” or “event rate” • Common risks or CIR’s • 5-year breast cancer survival rate • 94% (for local stage), 18% (for distant stage) • Case-fatality rate • 23% of neonates with bloody D and fever die (e.g., Africa) • In-hospital case-fatality (mortality) rate • 5% of hospitalized patients die at hospital X. • Attack rate • 25% of passengers on a cruise ship got V&D Mathew J. Reeves, Dept. of Epidemiology, Mich State Univ.
Incidence Density Rate (IDR) Defn: the speed at which a defined at-risk group or population develops a new clinical condition or outcome over a given time period. • IDR = Number of newly disease individuals Sum of time periods for all disease-free indv.-at-risk • denominator is "person-time" or "population time“ • a measure of the instantaneous force or speed of disease • IDR ranges from 0 to infinity (it is not a proportion!) • dimension = per unit time or the reciprocal of time (time-1) Mathew J. Reeves, Dept. of Epidemiology, Mich State Univ.
The Concept of “person-time” • the sum of the disease-free time experience for individuals at risk in the population • Concept: 100 people followed for 6 months have same person-time experience as 50 people followed for a year. • 100 x 0.5 = 50 person-years • 50 x 1.0 = 50 person-years • How to calculate? (add up disease-free time) • 100 subjects followed for 6 months • 1 new case develops on day 1 of each successive month (i.e., 2 thru 6): • Person time is the sum of disease free-time for each month (1 thru 6) • = 100 + 99 + 98 + 97 + 96 + 95 = 585 months • IDR = 5/585 person-months or 8.54 per 1,000 person months • Person time can be measured with whatever scale that makes the most sense i.e., person-days, person-weeks, person-months, person-years (PY) Mathew J. Reeves, Dept. of Epidemiology, Mich State Univ.
Incidence Density Rate (IDR) • A measure of the “speed” that disease is occurring • IDR answers the question: “At what rate are new cases of disease occurring in the population” • Common IDR’s • Mortality rate (Vital Statistics) • Lung CA mortality rate = 50 per 100,000 PY • Breast CA mortality rate = 15 per 100,000 PY • Disease Incidence Rates • IDR of neonatal diarrhea = 280 per 1,000 child weeks • Disease specific IDR rates • Calculated for specific sub-sets defined by age, gender or race • Black Men: Lung CA incidence rate = 122 per 100,000 PY • Wh. Female: Lung CA incidence rate = 43 per 100,000 PY Mathew J. Reeves, Dept. of Epidemiology, Mich State Univ.
Concept of the Prevalence “Pool” New cases (Incidence) Recovery rate Death rate Mathew J. Reeves, Dept. of Epidemiology, Mich State Univ.
Relationship between Prevalence and Incidence • Prevalence is a function of: • the incidence of the condition, and • the average duration of the condition • duration is influenced in turn by the recovery rate and mortality rate • Prev ~ Incidence x Duration • This relationship explains why…. • Arthritis is common (“prevalent”) in the elderly • Rabies is rare. • Influenza is only common during epidemics. Mathew J. Reeves, Dept. of Epidemiology, Mich State Univ.
Measures of Effect - Presentation and Interpretation of Information on Risk • Information on the effect of a treatment can be presented in several different ways • Relative Risk (RR) • Relative Risk Reduction (RRR) • Absolute Risk Reduction (ARR) • NNT (Number needed to treat) • The way risk information is presented can have a profound effect on clinical decisions (both on part of patients and doctors) Mathew J. Reeves, Dept. of Epidemiology, Mich State Univ.
Outcome Yes No The 2 x 2 Table – Clinical Intervention Study (RCT) Intervention (t) a b Riskt = a / a + b Treatment Group Riskc = c / c + d c d Control (placebo) (c) (Risk = CIR) Mathew J. Reeves, Dept. of Epidemiology, Mich State Univ.
Outcome Death Survival Example – RCT of Endoscopic Ligation vs. Endoscopic Sclerotherapy For Bleeding Esophageal Varices (Stiegmann, NEJM, 1992) Ligation (t) 18 46 Riskt = 18 / 64 = 0.28 Treatment Group Riskc = 29 / 65 = 0.45 29 36 Sclerotherapy (c) Riskt and Riskc are the risks of death in the treatment and control groups, respectively. Riskc is often referred to as the baseline risk. Mathew J. Reeves, Dept. of Epidemiology, Mich State Univ.
Relative Risk (RR) – RCT’s • Defn: The relative probability (or risk) of the event in the treatment group compared to the control group • RR = Riskt /Riskc • RR = 0.28 / 0.45 = 0.62 • Clinical interpretation (RCT): • “the death rate after ligation treatment is 0.62 times lower than the death rate after sclerotherapy treatment” • A measure of the efficacy of a treatment • Null value = 1.0. • RR < 1.0 = decreased risk (beneficial treatment) • RR > 1.0 = increased risk (harmful treatment) • Not a very useful measure of the clinical impact of treatment (need ARR) Mathew J. Reeves, Dept. of Epidemiology, Mich State Univ.
Relative Risk Reduction (RRR) • Defn: The proportion of the baseline risk that is removed by therapy • RRR = 1 – RR • RRR = 1 - 0.62 = 0.38 or 38% • Clinical interpretation (RCT): • “the death rate is 38% lower after ligation treatment compared to sclerotherapy treatment” • Indicates by how much in relative terms the event rate is decreased. • Also calculated as the ARR divided by the baseline risk • ARR/ Riskc = [0.45-0.28]/0.45 = 38% • Null value = 0. Mathew J. Reeves, Dept. of Epidemiology, Mich State Univ.
Absolute Risk Reduction (ARR) • Defn: The difference in absolute risk (or probability of events) between the control and treatment groups • ARR = Riskc - Riskt • ARR = 0.45 - 0.28 / = 0.17 • Clinical interpretation (RCT): • “the absolute risk of death is 17% lower with ligation treatment compared to sclerotherapy treatment” • A simple and direct measure of the impact of treatment • Also be called the risk difference (RD) or attributable risk • The ARR depends on the background baseline risk which can vary markedly from one population to another. • Null value = 0. Mathew J. Reeves, Dept. of Epidemiology, Mich State Univ.
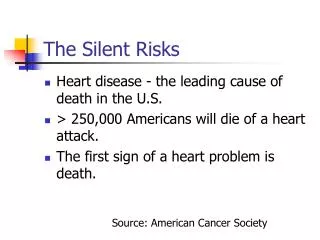
ARR= 10% ARR= 3.3% ARR = 0.33% Mathew J. Reeves, Dept. of Epidemiology, Mich State Univ.
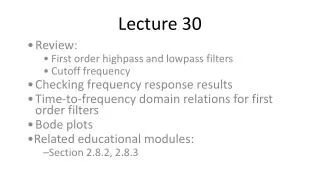
The Number Needed To Treat (NNT) • Defn: The number of patients who would need to be treated to prevent an adverse event • NNT = 1 / ARRNNT = 1 / 0.17 = 5.9 (or 6) • Clinical interpretation (RCT): • “for every 6 patients who received ligation treatment rather than sclerotherapy treatment, one death is prevented” • A very useful clinical measure because it is more interpretable that the ARR and it conveys the impact of a clinical intervention • NNT for primary stroke prevention for statins = 13,000 a year • NNT for secondary stroke prevention for statins = 57 a year • NNT depends on the efficacy of the intervention (= RRR) and the underlying baseline risk Mathew J. Reeves, Dept. of Epidemiology, Mich State Univ.
Effect of Base-line Risk and Relative Risk Reduction on NNT Mathew J. Reeves, Dept. of Epidemiology, Mich State Univ.
How information is conveyed (RRR, ARR or NNT) makes a difference! • Drug effects are perceived to be much more favourable when they are presented as RRRs rather than ARRs • See article by Skolbekken in the course pack. • Pay attention to how data on the effects of drugs are framed in advertisements. Mathew J. Reeves, Dept. of Epidemiology, Mich State Univ.
Relative Risk (RR) – Cohort studies • In cohort studies, RR is also used to measure the magnitude of association between an exposure (risk factor) and an outcome (See lecture 8). • Defn: The relative probability (or risk) of disease in the exposed group compared to the non-exposed group • Example: Smoking and Lung CA • IDR of lung CA death in heavy smokers = 4.17 per 1,000 person years • IDR of lung CA death in non-smokers = 0.17 per 1,000 person years • RR = Riskwxp /Riskunexp = 4.17/0.17 = 24.5 • Clinical interpretation (cohort): • “the risk of dying of lung CA is about 25 times higher in lifetime heavy smokers compared to lifetime non-smokers” • Not a very useful measure of the impact of the risk factor in the population (need PARF) Mathew J. Reeves, Dept. of Epidemiology, Mich State Univ.
Other important effect measures not covered in this lecture • Odds ratio (OR) • See course notes, plus will be covered in the lecture 9 on case-control studies • Population attributable risk (PAR) • (See course notes) • Population attributable risk fraction (PARF) • (See course notes) Mathew J. Reeves, Dept. of Epidemiology, Mich State Univ.