Download
1 / 19
200 likes | 345 Vues
Use of Statistics in Evaluation of Trace Evidence. Robert D. Koons CFSRU, FBI Academy Quantico, VA 22135. Trace Evidence Symposium 8/15/2007, Clearwater Beach, Florida. My rules for comparison of trace evidence. Comparison of trace evidence is best thought of as a process of elimination.

E N D
Use of Statistics in Evaluation of Trace Evidence Robert D. Koons CFSRU, FBI Academy Quantico, VA 22135 Trace Evidence Symposium 8/15/2007, Clearwater Beach, Florida
My rules for comparison of trace evidence • Comparison of trace evidence is best thought of as a process of elimination. • Selection of features for comparison that provide the best source discrimination is always a good idea. • Match criteria do not have to be statistically-based to be effective. • Frequency of occurrence statistics for trace evidence can almost never be calculated for good discriminating features. • Databases are useful for making broad classification rules, but they are generally useless for calculating the significance of a match.
Characteristics of Measurements on Trace Evidence • Data for many variables are “continuous” • Data distributions are “often” unknown • Frequency distributions are nonstandard • Across-sample distributions are unknown • Accuracy and precision of data depends on analytical method • Databases are both time and location dependent • Forensic and scientific (statistical) issues may not be the same
Source 2 Source 1 Measured Values Increasing Significance of a Match Q
Fisher’s Ratio measure for linear discriminating power of a variable m1 and m2 are the means of class 1 and class 2 v1 and v2 are the variances
Truth Table Truth Decision
Roles in Sample Comparison Do the samples match? Analytical Science Statistics What is the significance?
Some Match Methodologies • t-test • Welch’s modification? • Multivariate (Bonferroni) correction? • Range overlap (many to many or one to many) • 2σ, 3σ, etc. (or 2s, 3s, etc.) • Continuous probabilistic approach • Dimension reduction, then match • Cluster analysis • Multivariate test (Hotelling’s t2) • Discriminant analysis (PCA)
Measured Distributions in a Sheet of Float Glass Refractive Index Aluminum Barium Calcium Iron Zinc
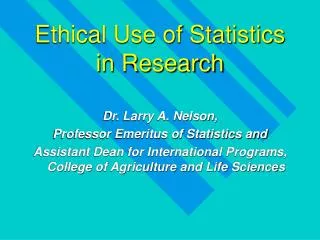
Fiber No 42 Fiber No 52
PCA plot of Australian ocher data B, Sc, Se, Rb, Pd, Hf, Th, and U in ochers from 3 areas of Australia From: R.L. Green & R.J. Watling, JFS 7/07
PCA plot of Australian ocher data ochers from 3 populations within a single region of Australia From: R.L. Green & R.J. Watling, JFS 7/07
Classification of laser jet toners LA-ICP-MS data, heirarchichal clustering, Euclidean distance, 9 elements, normalized
Star Plots Polyethylene Trash Bags