Maternal and Infant Health Data South Carolina 2003-2014
Explore key statistics on preterm birth, late preterm birth, low birthweight, cesarean deliveries, mortality rates, maternal health, smoking, and obesity in South Carolina from 2003 to 2014. Source: National Center for Health Statistics.

Maternal and Infant Health Data South Carolina 2003-2014
E N D
Presentation Transcript
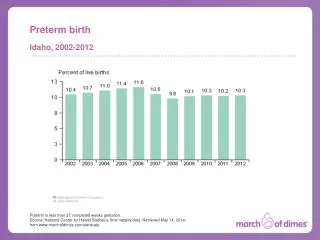
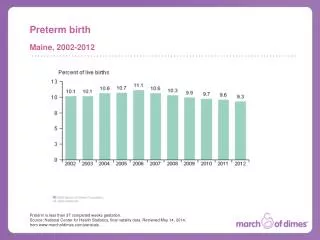
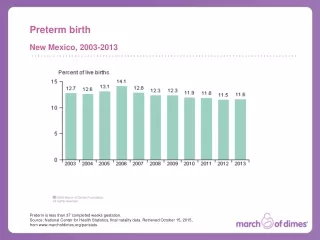
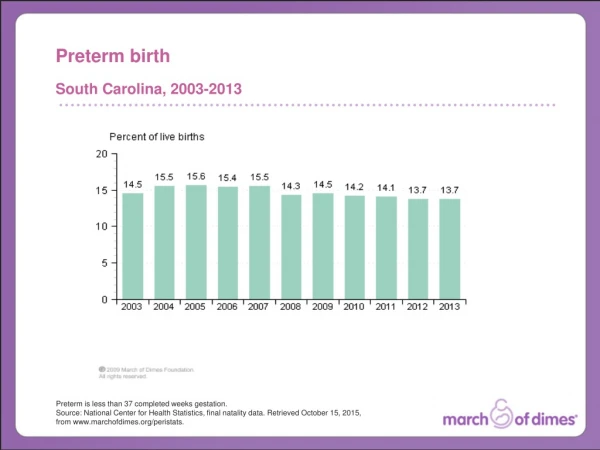
Preterm birth South Carolina, 2003-2013 Preterm is less than 37 completed weeks gestation. Source: National Center for Health Statistics, final natality data. Retrieved October 15, 2015, from www.marchofdimes.org/peristats.
Preterm by maternal age South Carolina, 2011-2013 Average Preterm is less than 37 completed weeks gestation. Source: National Center for Health Statistics, final natality data. Retrieved October 15, 2015, from www.marchofdimes.org/peristats.
Preterm by race/ethnicity South Carolina, 2011-2013 Average All race categories exclude Hispanics. Preterm is less than 37 completed weeks gestation. Source: National Center for Health Statistics, final natality data. Retrieved October 15, 2015, from www.marchofdimes.org/peristats.
Late preterm births South Carolina, 2003-2013 Late preterm is between 34 and 36 weeks gestation. Source: National Center for Health Statistics, final natality data. Retrieved October 15, 2015, from www.marchofdimes.org/peristats.
Low birthweight South Carolina, 2003-2013 Low birthweight is less than 2500 grams (5 1/2 pounds). Source: National Center for Health Statistics, final natality data. Retrieved October 15, 2015, from www.marchofdimes.org/peristats.
Total cesarean deliveries South Carolina, 2003-2013 Source: National Center for Health Statistics, final natality data. Retrieved October 15, 2015, from www.marchofdimes.org/peristats.
Infant mortality rates South Carolina, 2003-2013 An infant death occurs within the first year of life. Source: National Center for Health Statistics, final mortality data, 1990-1994 and period linked birth/infant death data, 1995-present. Retrieved October 15, 2015, from www.marchofdimes.org/peristats.
Perinatal mortality rates South Carolina, 2002-2006 Perinatal deaths include fetal deaths at 28 weeks gestation or more and infant deaths less than one week of age. Source: National Center for Health Statistics, fetal mortality data and period linked birth/infant death data. Retrieved October 15, 2015, from www.marchofdimes.org/peristats.
Late fetal mortality rates South Carolina, 2002-2006 A late fetal death occurs at 28 weeks of gestation or more. Source: National Center for Health Statistics, fetal mortality data. Retrieved October 15, 2015, from www.marchofdimes.org/peristats.
Maternal mortality rates South Carolina and US, 2003-2007 Average Footnotes available in notes section. Source: National Center for Health Statistics, final mortality data; National Center for Health Statistics, final natality data. Retrieved October 15, 2015, from www.marchofdimes.org/peristats.
Smoking during pregnancy(PRAMS) South Carolina, 2000-2007 Smoking during pregnancy: mother reported smoking during the last three months of pregnancy. For more information about the availability of PRAMS data by state and year, refer to the <a href="http://www.marchofdimes.org/peristats/calculations.aspx" target="_blank">Calculations</a> page. Source: Centers for Disease Control and Prevention, Pregnancy Risk Assessment Monitoring System. Retrieved October 15, 2015, from www.marchofdimes.org/peristats. The mark “CDC” is owned by the US Dept. of Health and Human Services and is used with permission. Use of this logo is not an endorsement by HHS or CDC of any particular product, service, or enterprise.
Smoking among women of childbearing age South Carolina, 2004-2014 Smoking is defined as having ever smoked 100 cigarettes in a lifetime and currently smoking everyday or some days. Percent reported is among women ages 18-44. The following states did not conduct BRFSS surveillance every year and are not included in U.S. rates for the respective years: AK(1990), AR(1990,1992), DC(1995), KS(1990,1991), HI(2004), NV(1990,1991), NJ(1990), WY(1990-1993). Source: Smoking: Behavioral Risk Factor Surveillance System. Behavioral Surveillance Branch, Centers for Disease Control and Prevention. Retrieved October 15, 2015, from www.marchofdimes.org/peristats.
Obesity before pregnancy(PRAMS) South Carolina, 2000-2007 Before pregnancy obesity: mother's pre-pregnancy body mass index classified as obese (BMI greater than 30.0). For more information about the availability of PRAMS data by state and year, refer to the <a href="http://www.marchofdimes.org/peristats/calculations.aspx" target="_blank">Calculations</a> page. Source: Centers for Disease Control and Prevention, Pregnancy Risk Assessment Monitoring System. Retrieved October 15, 2015, from www.marchofdimes.org/peristats. The mark “CDC” is owned by the US Dept. of Health and Human Services and is used with permission. Use of this logo is not an endorsement by HHS or CDC of any particular product, service, or enterprise.
Obesity among women of childbearing age South Carolina, 2004-2014 The following states did not conduct BRFSS surveillance every year and are not included in U.S. rates for the respective years: AK(1990), AR(1990,1992), DC(1995), KS(1990,1991), HI(2004), NV(1990,1991), NJ(1990), WY(1990-1993). Obesity is defined as a Body Mass Index of 30 or more. Body Mass Index (BMI) is a number calculated from a person's weight and height. Percent reported is among women ages 18-44. Source: Behavioral Risk Factor Surveillance System, Centers for Disease Control and Prevention. Retrieved October 15, 2015, from www.marchofdimes.org/peristats.
Uninsured women South Carolina and US, 2010-2012 Average Source: US Census Bureau. Data prepared for the March of Dimes using the Current Population Survey Annual Social and Economic Supplements. Retrieved October 15, 2015, from www.marchofdimes.org/peristats.